A one-way ANOVA is used to determine whether or not there is a statistically significant difference between the means of three or more independent groups.
This tutorial provides a step-by-step example of how to perform a one-way ANOVA in Google Sheets.
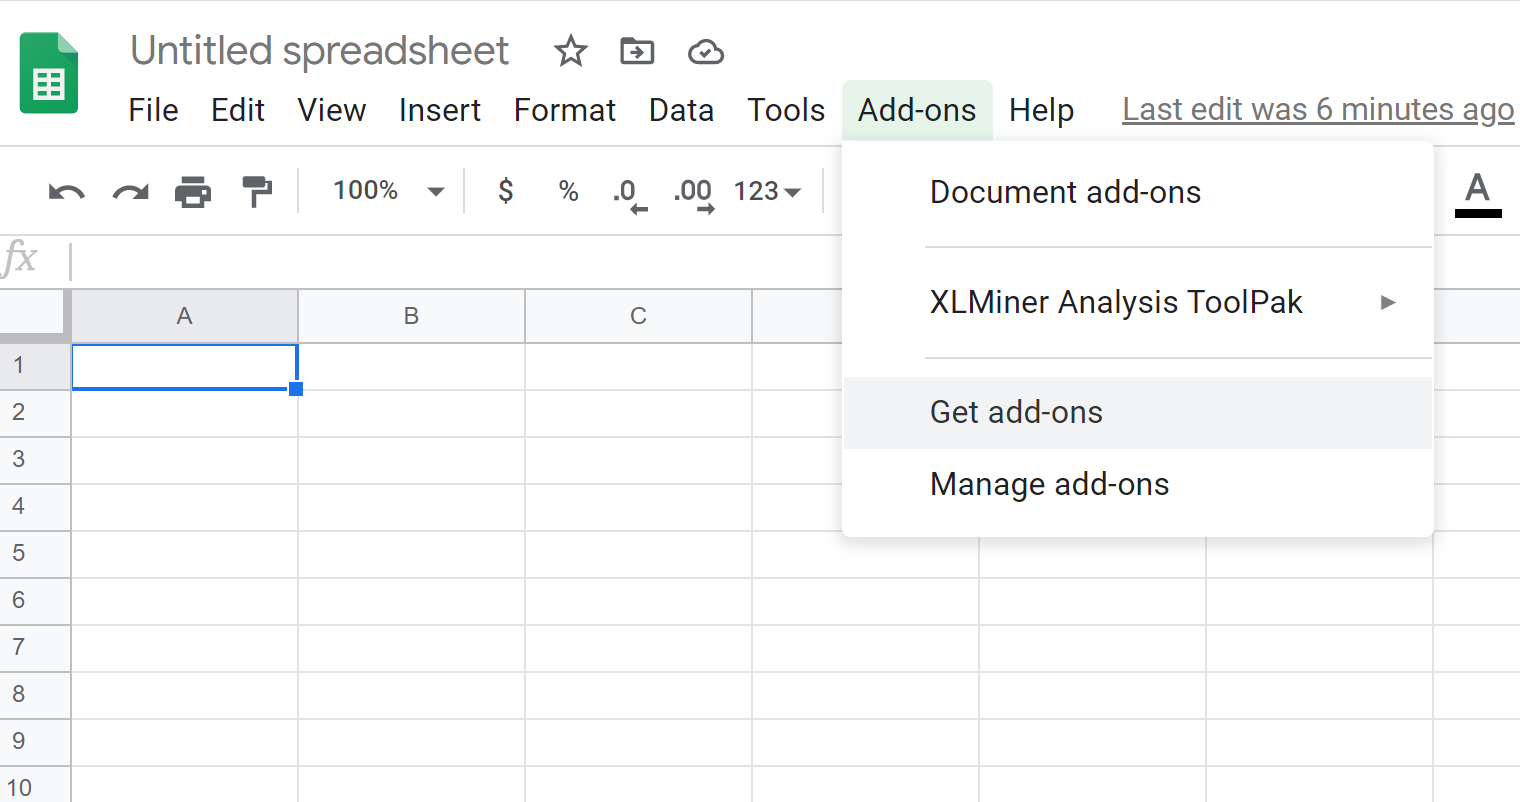
Step 1: Install the XLMiner Analysis ToolPak
To perform a one-way ANOVA in Google Sheets, we need to first install the free XLMiner Analysis Toolpak.
To do so, click Add-ons > Get add-ons:
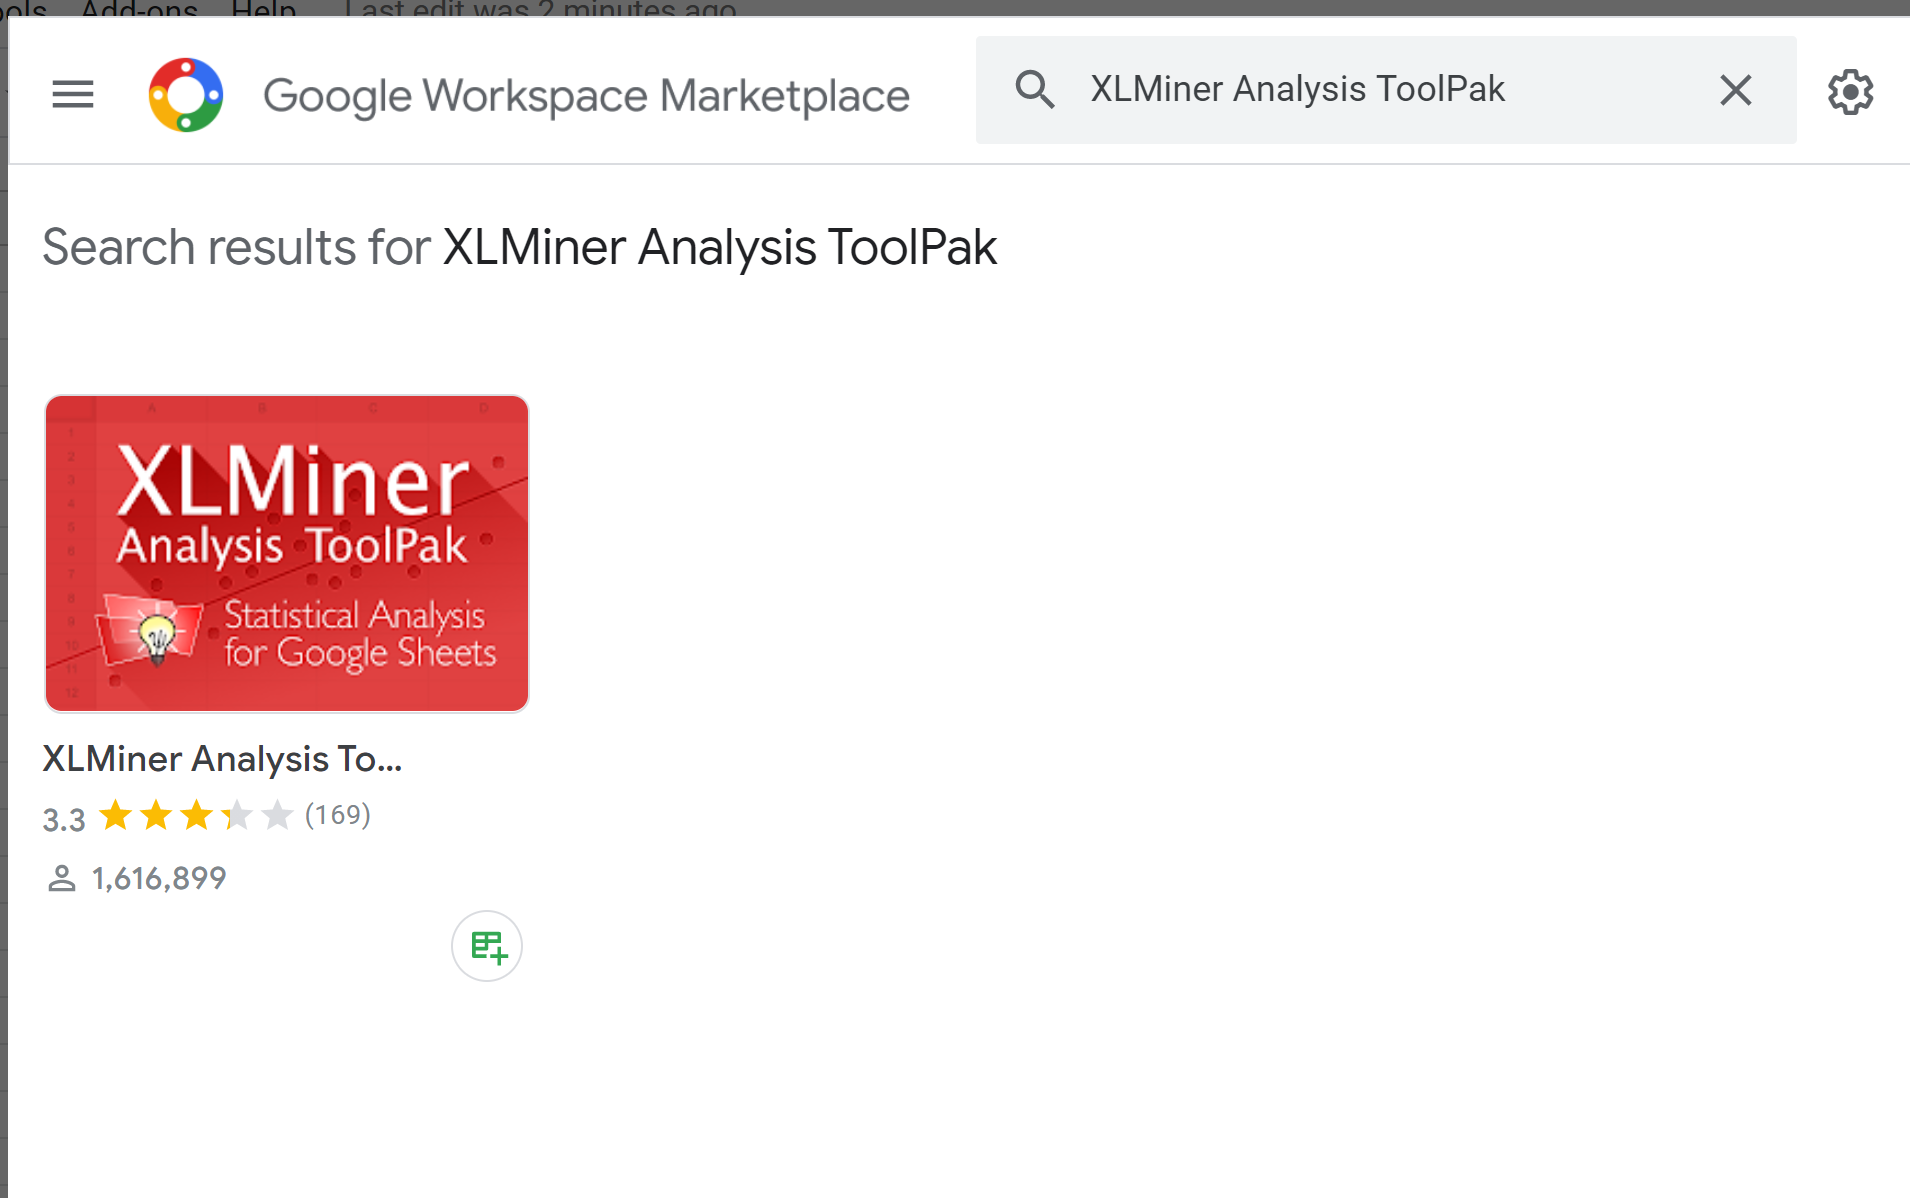
Next, type XLMiner Analysis ToolPak in the search bar and click the icon that appears:
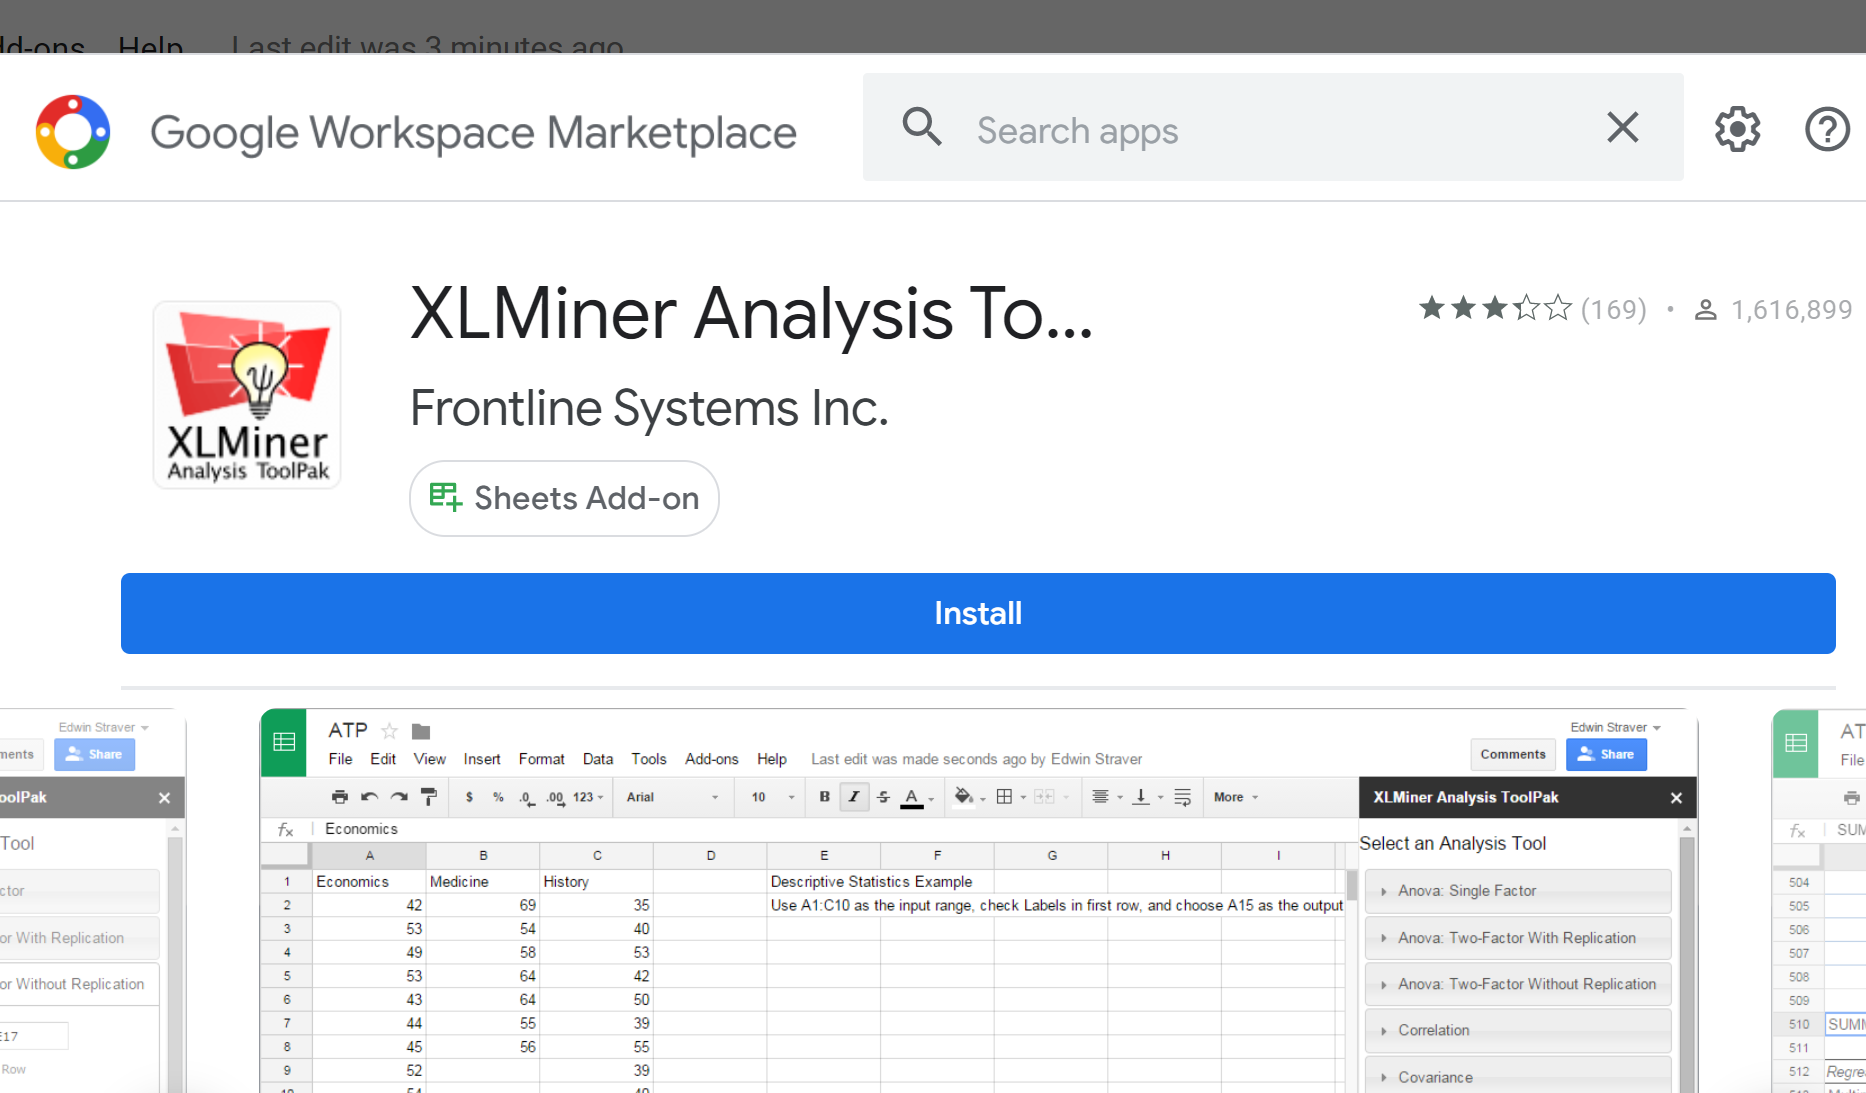
Lastly, click the Install button.
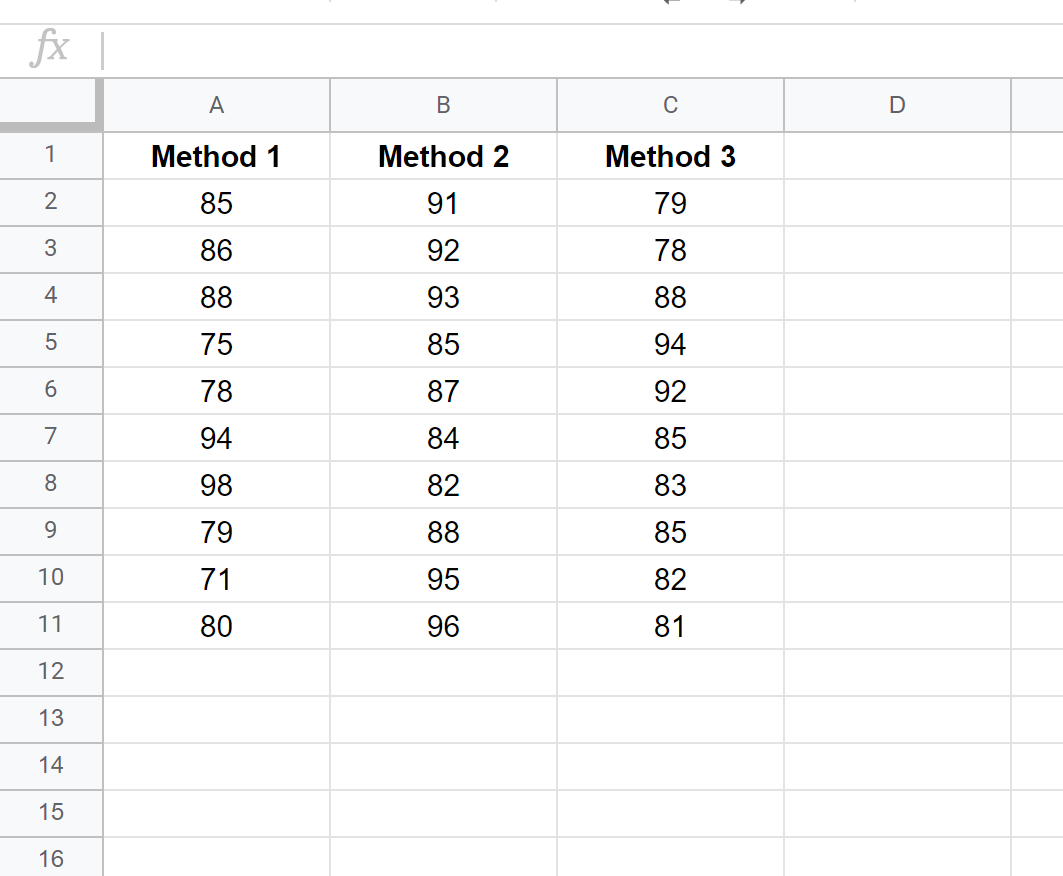
Step 2: Enter the Data
Next, we need to enter the data to use for the one-way ANOVA.
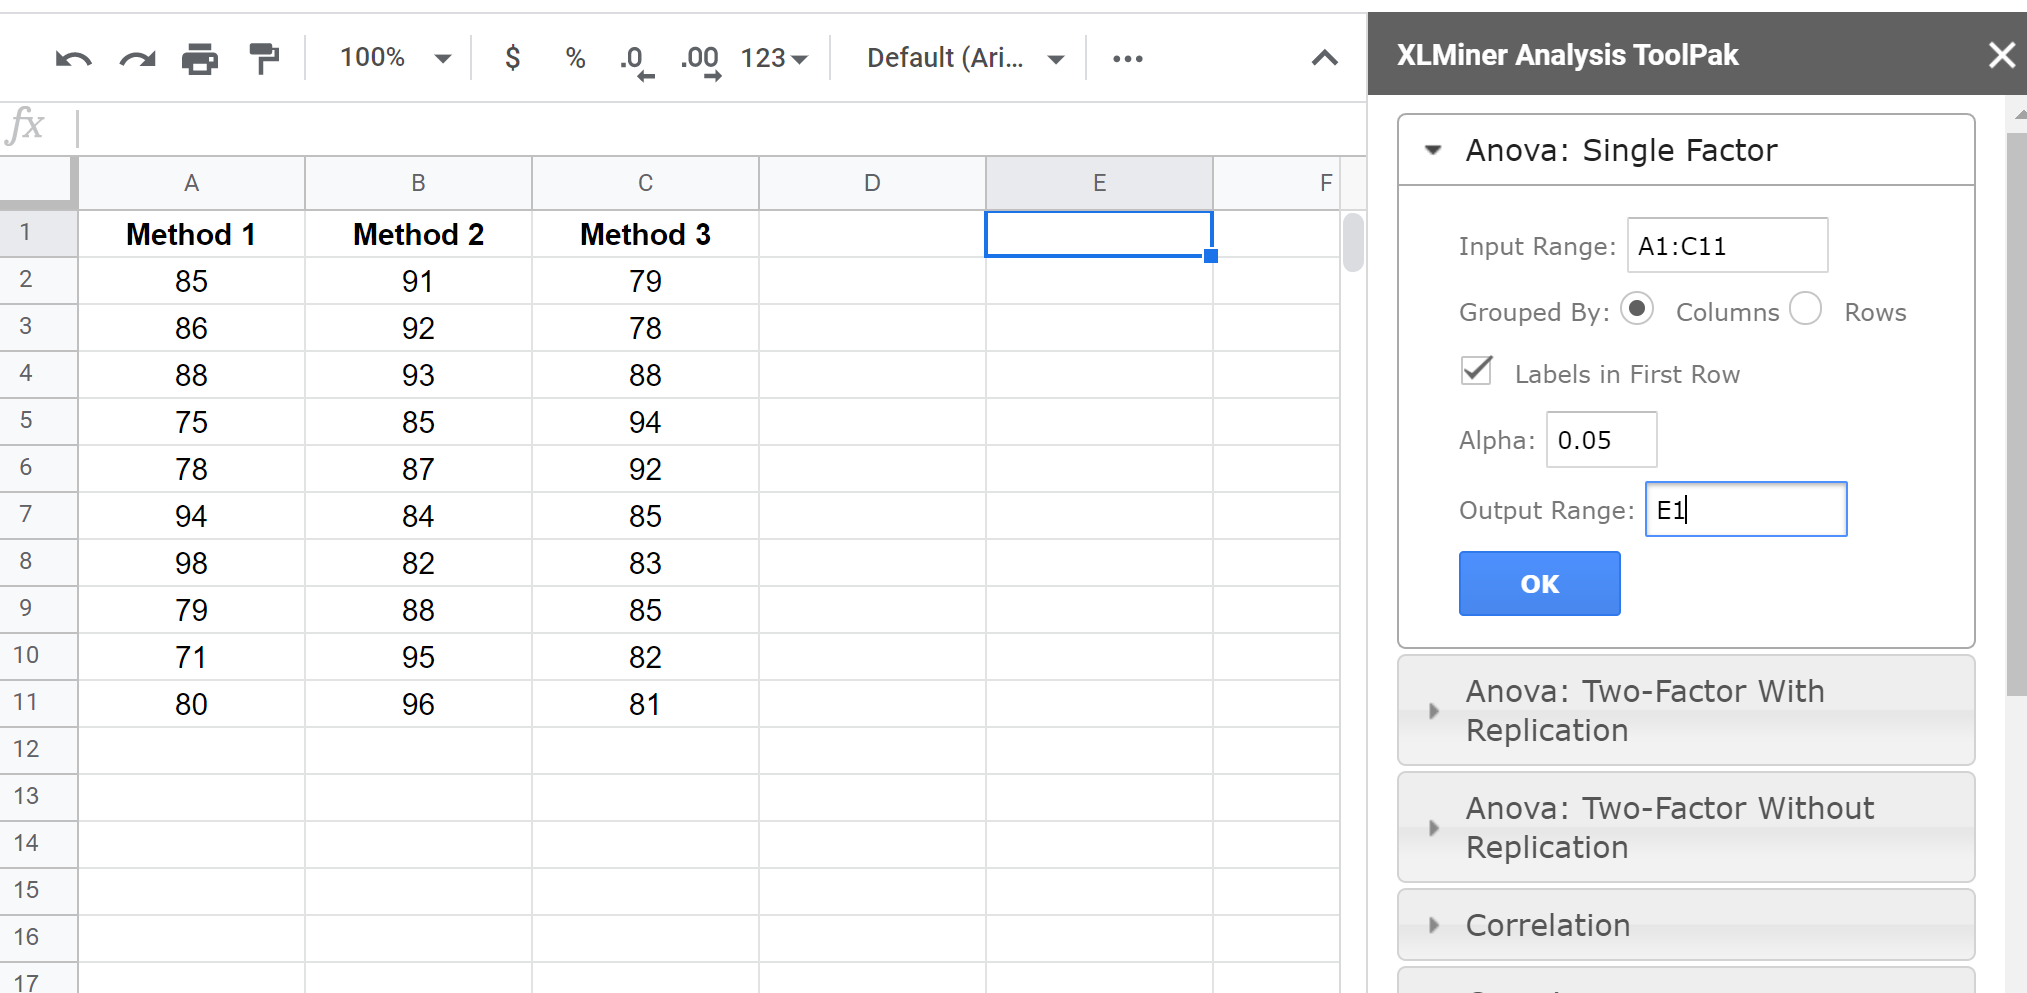
For this example, suppose a researcher recruits 30 students to participate in a study. The students are randomly assigned to use one of three studying methods to prepare for an exam. The exam results for each student are shown below:
Step 3: Perform the One-Way ANOVA
To perform a one-way ANOVA on this dataset, click Add-ons > XLMiner Analysis ToolPak > Start. The Analysis ToolPak will appear on the right side of the screen.
Click Anova: Single Factor and fill in the following information:
Step 4: Interpret the Results
Once you click OK, the results of the one-way ANOVA will appear starting in the cell you specified in Output Range. In our case, we chose to display the results starting in cell E1:
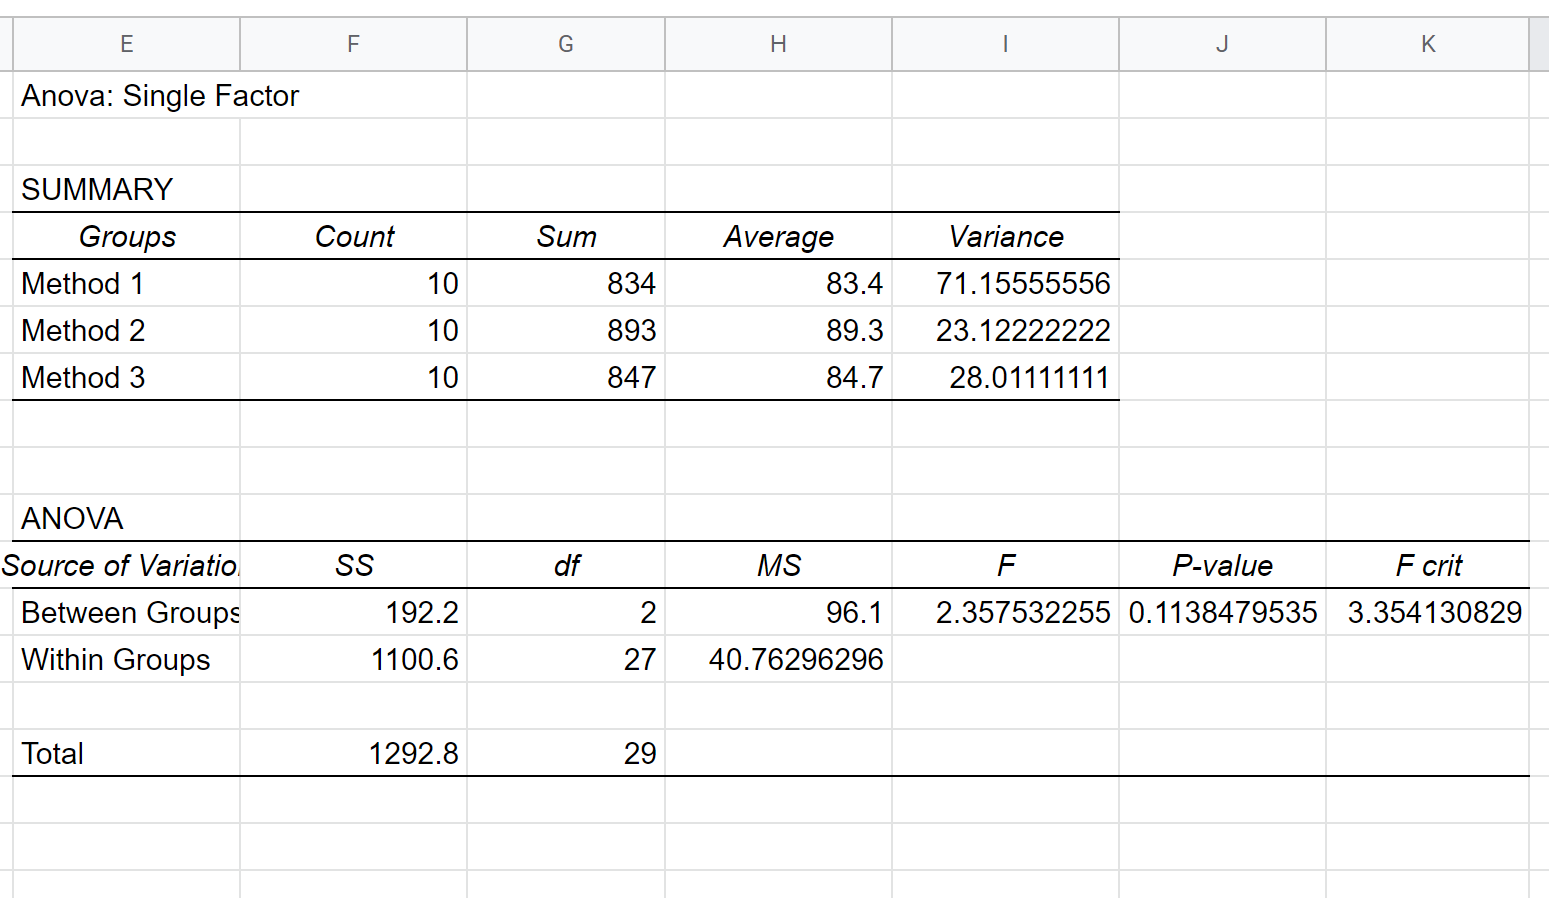
There are two tables shown in the output.
The first table shows the count, sum, average, and variance of the test scores for each of the three groups.
The second table displays the results of the one-way ANOVA, including:
- F-statistic: 2.3575
- F Critical value: 3.3541
- P-value: 0.1138
Recall that a one-way ANOVA has the following null and alternative hypotheses:
- H0 (null hypothesis): All group means are equal.
- HA (alternative hypothesis): At least one group mean is different from the rest.
Since the p-value in the ANOVA table (.1138) is not less than .05, we do not have sufficient evidence to reject the null hypothesis.
Thus, we don’t have evidence to say that the three different studying methods lead to different exam scores.
Additional Resources
How to Perform a One-Way ANOVA in Excel
How to Perform a One-Way ANOVA by Hand
One-Way ANOVA Calculator