A one sample t-test is used to test whether or not the mean of a population is equal to some value.
This tutorial explains the following:
- The motivation for performing a one sample t-test.
- The formula to perform a one sample t-test.
- The assumptions that should be met to perform a one sample t-test.
- An example of how to perform a one sample t-test.
One Sample t-test: Motivation
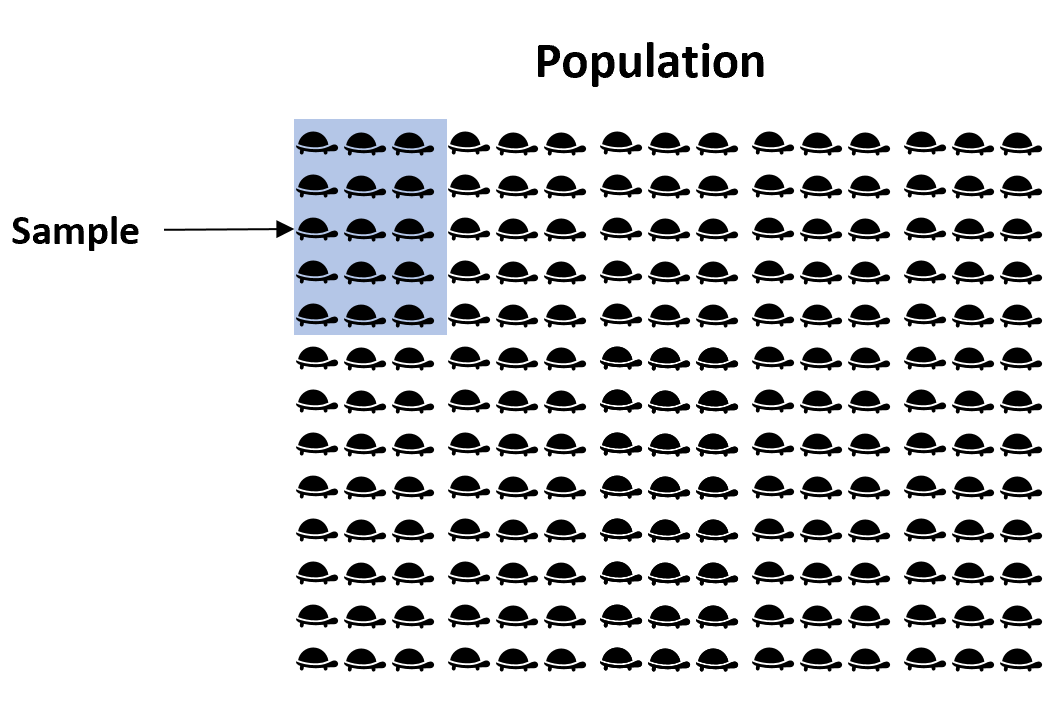
Suppose we want to know whether or not the mean weight of a certain species of turtle in Florida is equal to 310 pounds. Since there are thousands of turtles in Florida, it would be extremely time-consuming and costly to go around and weigh each individual turtle.
Instead, we might take a simple random sample of 40 turtles and use the mean weight of the turtles in this sample to estimate the true population mean:
However, it’s virtually guaranteed that the mean weight of turtles in our sample will differ from 310 pounds. The question is whether or not this difference is statistically significant. Fortunately, a one sample t-test allows us to answer this question.
One Sample t-test: Formula
A one-sample t-test always uses the following null hypothesis:
- H0: μ = μ0 (population mean is equal to some hypothesized value μ0)
The alternative hypothesis can be either two-tailed, left-tailed, or right-tailed:
- H1 (two-tailed): μ ≠ μ0 (population mean is not equal to some hypothesized value μ0)
- H1 (left-tailed): μ 0 (population mean is less than some hypothesized value μ0)
- H1 (right-tailed): μ > μ0 (population mean is greater than some hypothesized value μ0)
We use the following formula to calculate the test statistic t:
t = (x – μ) / (s/√n)
where:
- x: sample mean
- μ0: hypothesized population mean
- s: sample standard deviation
- n: sample size
If the p-value that corresponds to the test statistic t with (n-1) degrees of freedom is less than your chosen significance level (common choices are 0.10, 0.05, and 0.01) then you can reject the null hypothesis.
One Sample t-test: Assumptions
For the results of a one sample t-test to be valid, the following assumptions should be met:
- The variable under study should be either an interval or ratio variable.
- The observations in the sample should be independent.
- The variable under study should be approximately normally distributed. You can check this assumption by creating a histogram and visually checking if the distribution has roughly a “bell shape.”
- The variable under study should have no outliers. You can check this assumption by creating a boxplot and visually checking for outliers.
One Sample t-test: Example
Suppose we want to know whether or not the mean weight of a certain species of turtle is equal to 310 pounds. To test this, will perform a one-sample t-test at significance level α = 0.05 using the following steps:
Step 1: Gather the sample data.
Suppose we collect a random sample of turtles with the following information:
- Sample size n = 40
- Sample mean weight x = 300
- Sample standard deviation s = 18.5
Step 2: Define the hypotheses.
We will perform the one sample t-test with the following hypotheses:
- H0: μ = 310 (population mean is equal to 310 pounds)
- H1: μ ≠ 310 (population mean is not equal to 310 pounds)
Step 3: Calculate the test statistic t.
t = (x – μ) / (s/√n) = (300-310) / (18.5/√40) = -3.4187
Step 4: Calculate the p-value of the test statistic t.
According to the T Score to P Value Calculator, the p-value associated with t = -3.4817 and degrees of freedom = n-1 = 40-1 = 39 is 0.00149.
Step 5: Draw a conclusion.
Since this p-value is less than our significance level α = 0.05, we reject the null hypothesis. We have sufficient evidence to say that the mean weight of this species of turtle is not equal to 310 pounds.
Note: You can also perform this entire one sample t-test by simply using the One Sample t-test calculator.
Additional Resources
The following tutorials explain how to perform a one-sample t-test using different statistical programs:
How to Perform a One Sample t-test in Excel
How to Perform a One Sample t-test in SPSS
How to Perform a One Sample t-test in Stata
How to Perform a One Sample t-test in R
How to Conduct a One Sample t-test in Python
How to Perform a One Sample t-test on a TI-84 Calculator