To “normalize” a set of data values means to scale the values such that the mean of all of the values is 0 and the standard deviation is 1.
This tutorial explains how to normalize data in Excel.
Example: How to Normalize Data in Excel
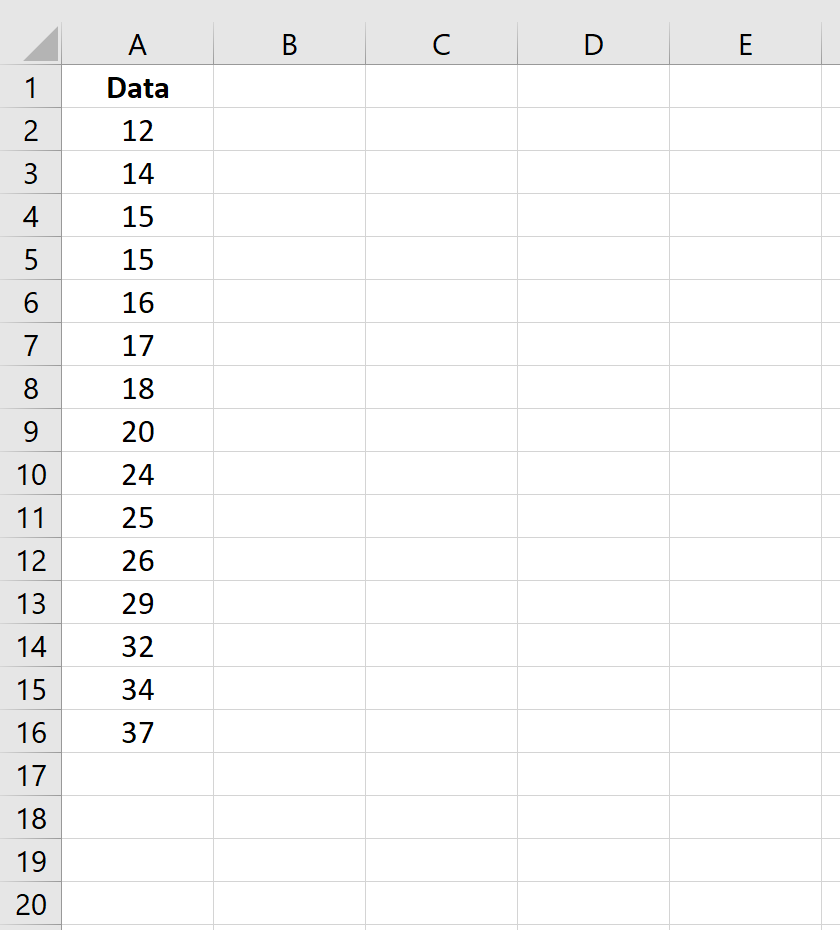
Suppose we have the following dataset in Excel:
Perform the following steps to normalize this set of data values.
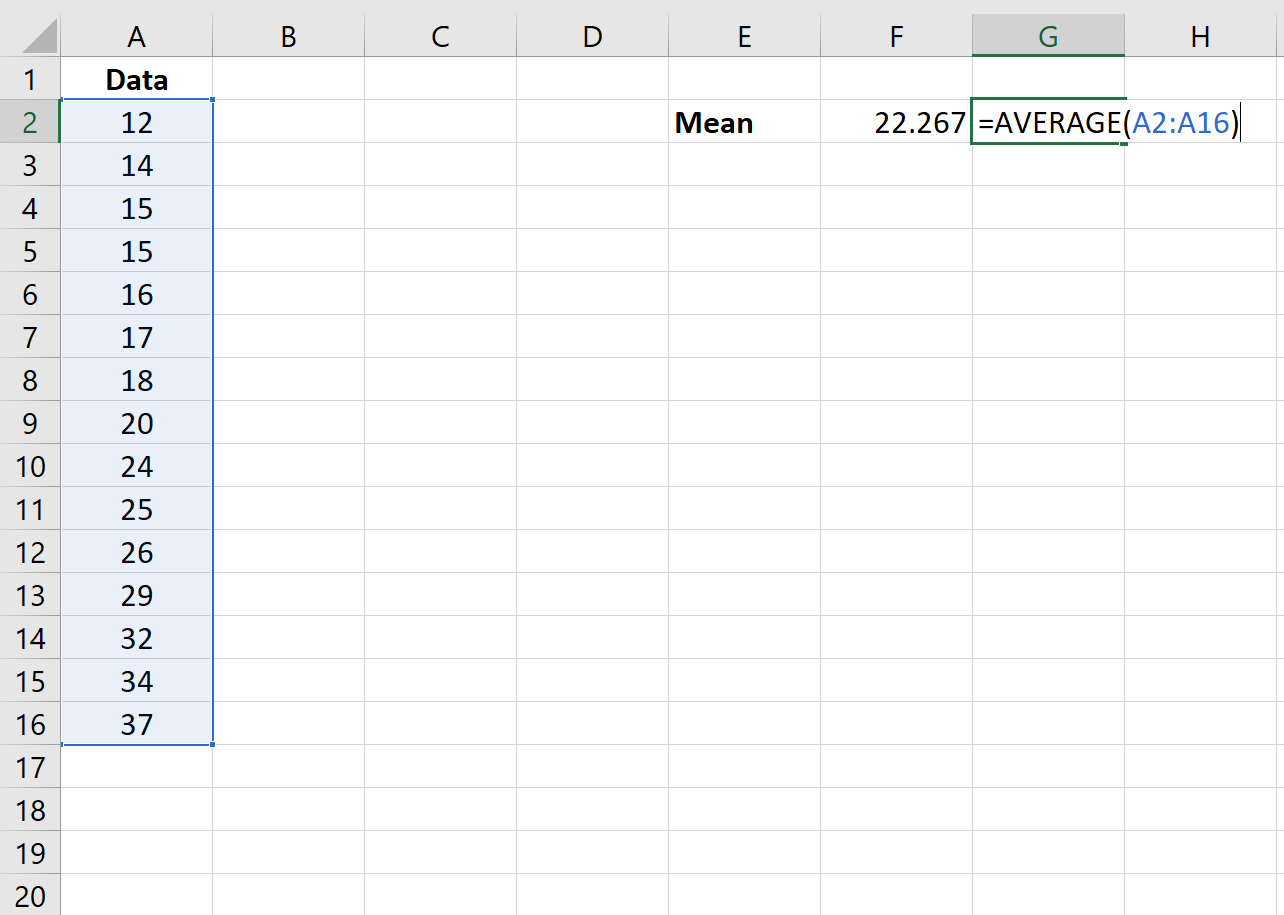
Step 1: Find the mean.
First, we will use the =AVERAGE(range of values) function to find the mean of the dataset.
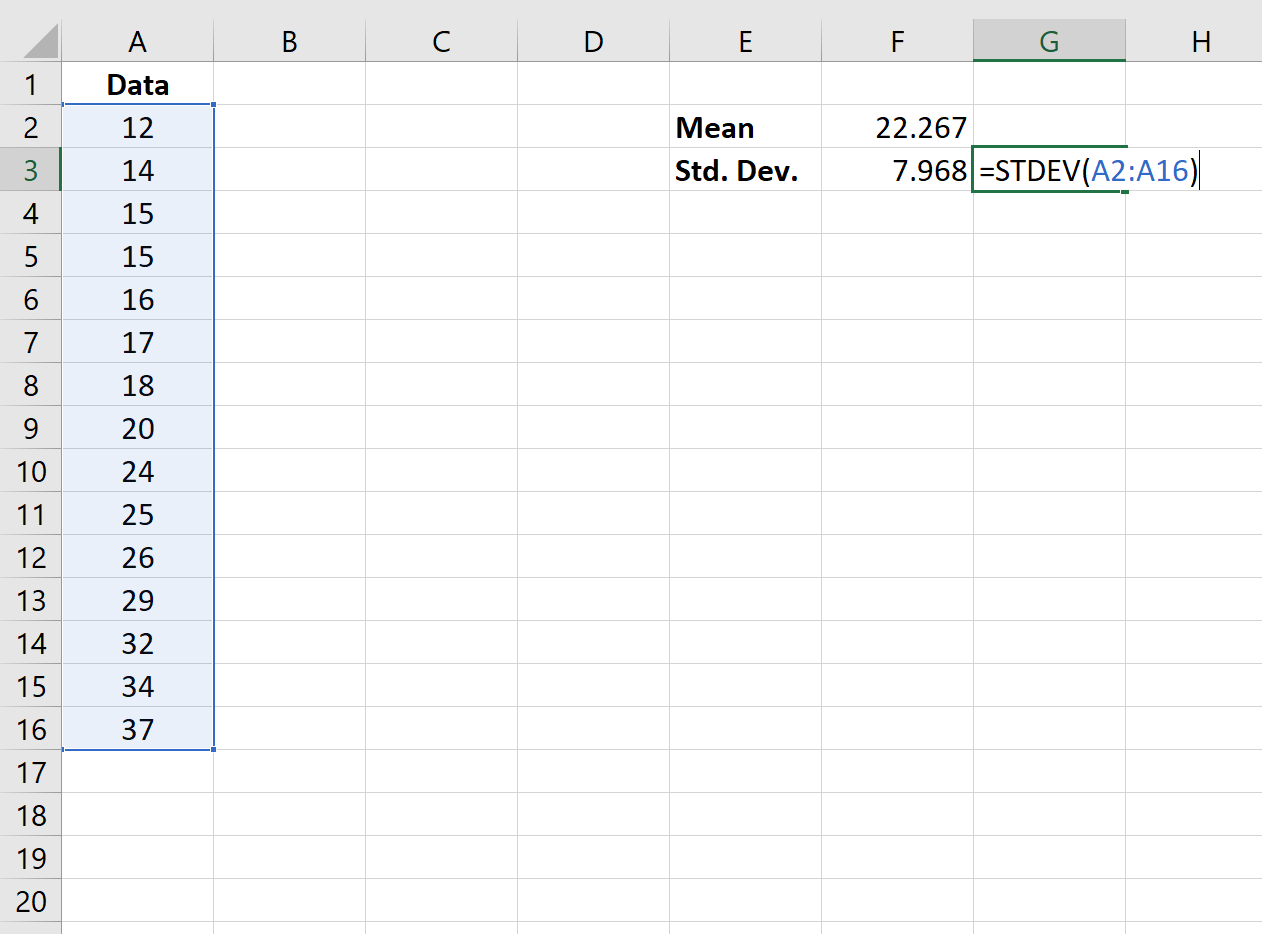
Step 2: Find the standard deviation.
Next, we will use the =STDEV(range of values) function to find the standard deviation of the dataset.
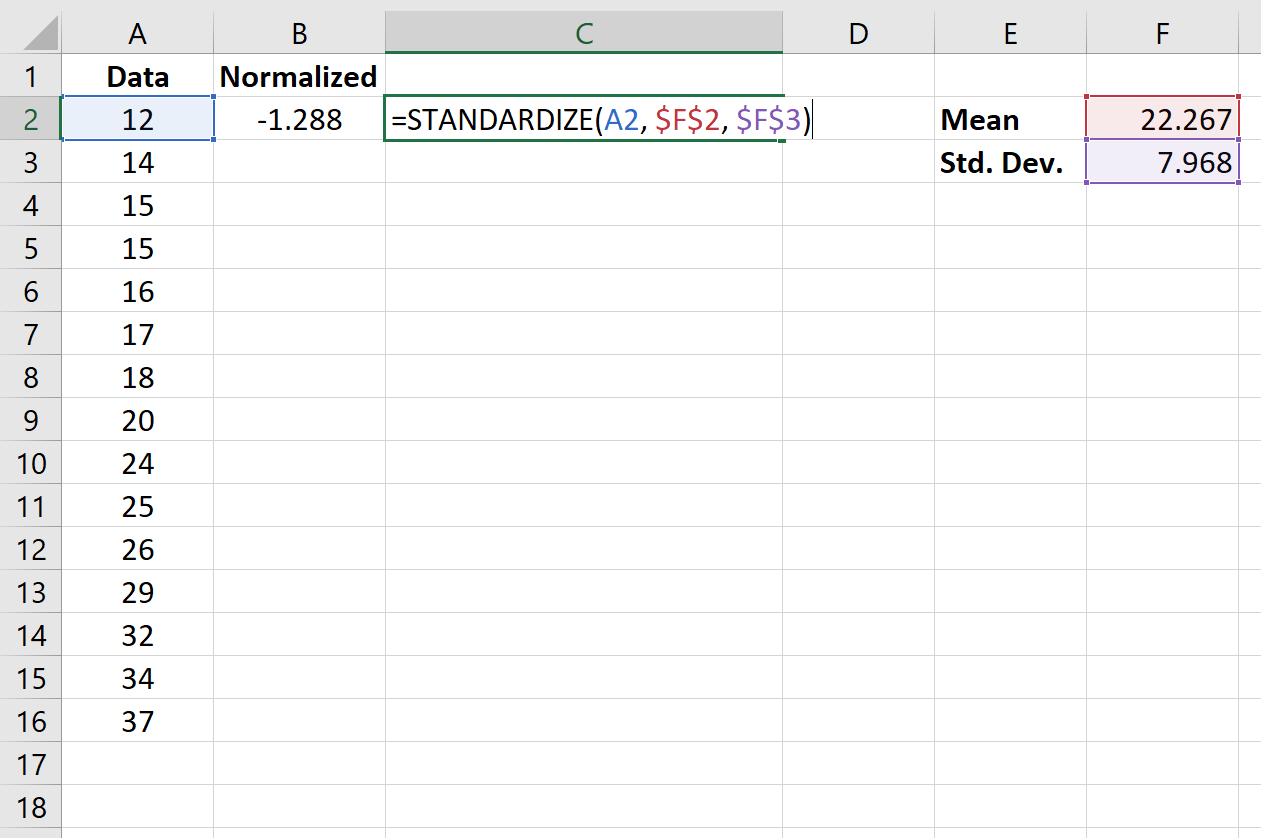
Step 3: Normalize the values.
Lastly, we will use the STANDARDIZE(x, mean, standard_dev) function to normalize each of the values in the dataset.
NOTE:
The STANDARDIZE function uses the following formula to normalize a given data value:
Normalized value = (x – x) / s
where:
- x = data value
- x = mean of dataset
- s = standard deviation of dataset
The following image shows the formula used to normalize the first value in the dataset:
Once we normalize the first value in cell B2, we can hover the mouse over the bottom right corner of cell B2 until a small + appears. Double click the + to copy the formula down to the remaining cells:
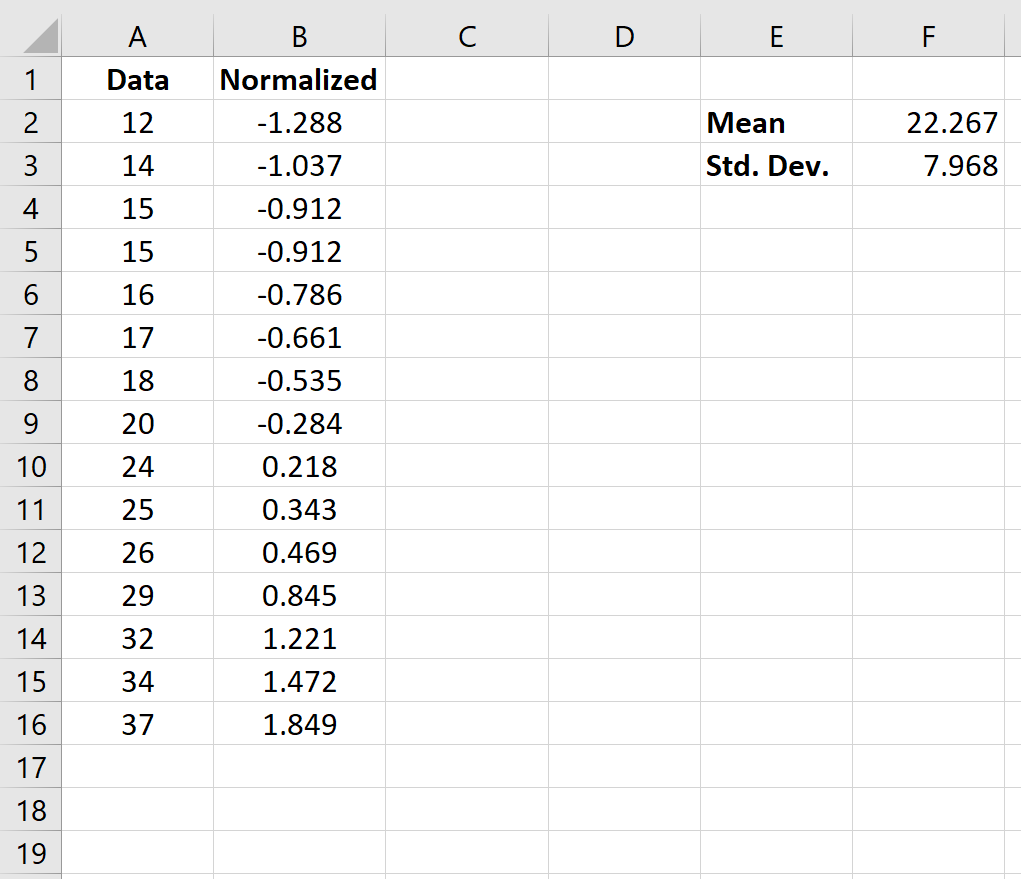
Now every value in the dataset is normalized.
How to Interpret Normalized Data
The formula that we used to normalize a given data value, x, was as follows:
Normalized value = (x – x) / s
where:
- x = data value
- x = mean of dataset
- s = standard deviation of dataset
If a particular data point has a normalized value greater than 0, it’s an indication that the data point is greater than the mean. Conversely, a normalized value less than 0 is an indication that the data point is less than the mean.
In particular, the normalized value tells us how many standard deviations the original data point is from the mean. For example, consider the data point “12” in our original dataset:
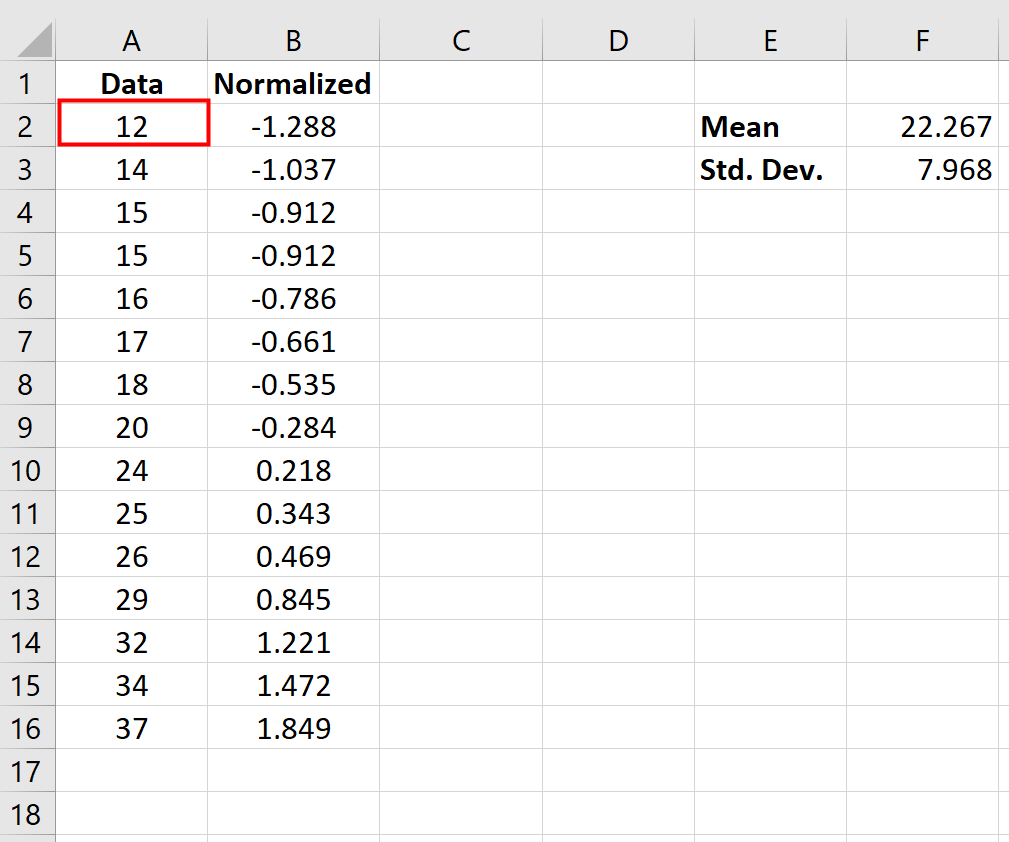
The normalized value for “12” turned out to be -1.288, which was calculated as:
Normalized value = (x – x) / s = (12 – 22.267) / 7.968 = -1.288
This tells us that the value “12” is 1.288 standard deviations below the mean in the original dataset.
Each of the normalized values in the dataset can help us understand how close or far a particular data value is from the mean. A small normalized value indicates that a value is close to the mean while a large normalized value indicates that a value is far from the mean.