Many statistical tests make the assumption that the values in a dataset are normally distributed.
One of the easiest ways to test this assumption is to perform a Jarque-Bera test, which is a goodness-of-fit test that determines whether or not sample data have skewness and kurtosis that matches a normal distribution.
This test uses the following hypotheses:
H0: The data is normally distributed.
HA: The data is not normally distributed.
The test statistic JB is defined as:
JB =(n/6) * (S2 + (C2/4))
where:
- n: the number of observations in the sample
- S: the sample skewness
- C: the sample kurtosis
Under the null hypothesis of normality, JB ~ X2(2).
If the p-value that corresponds to the test statistic is less than some significance level (e.g. α = .05), then we can reject the null hypothesis and conclude that the data is not normally distributed.
This tutorial provides a step-by-step example of how to perform a Jarque-Bera test for a given dataset in Excel.
Step 1: Create the Data
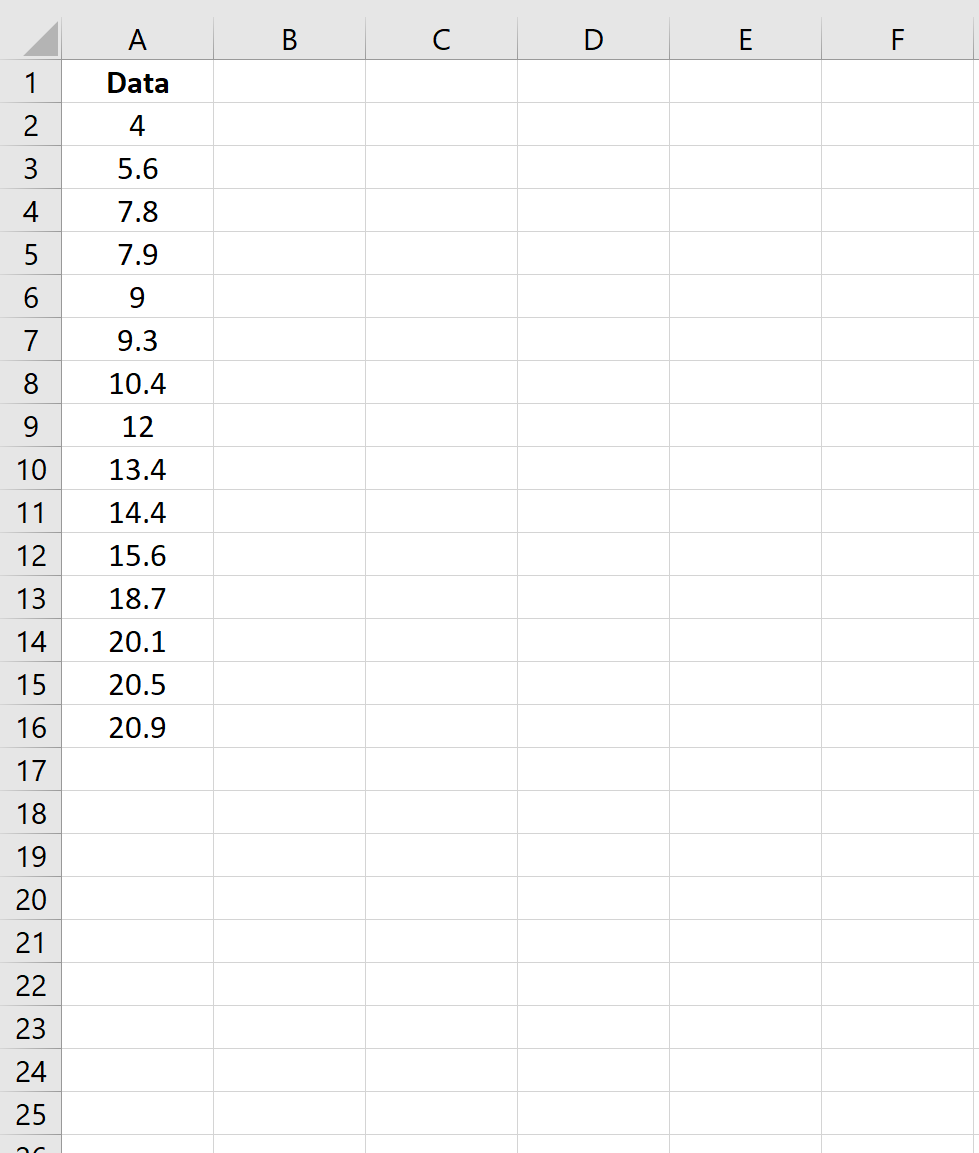
First, let’s create a fake dataset with 15 values:
Step 2: Calculate the Test Statistic
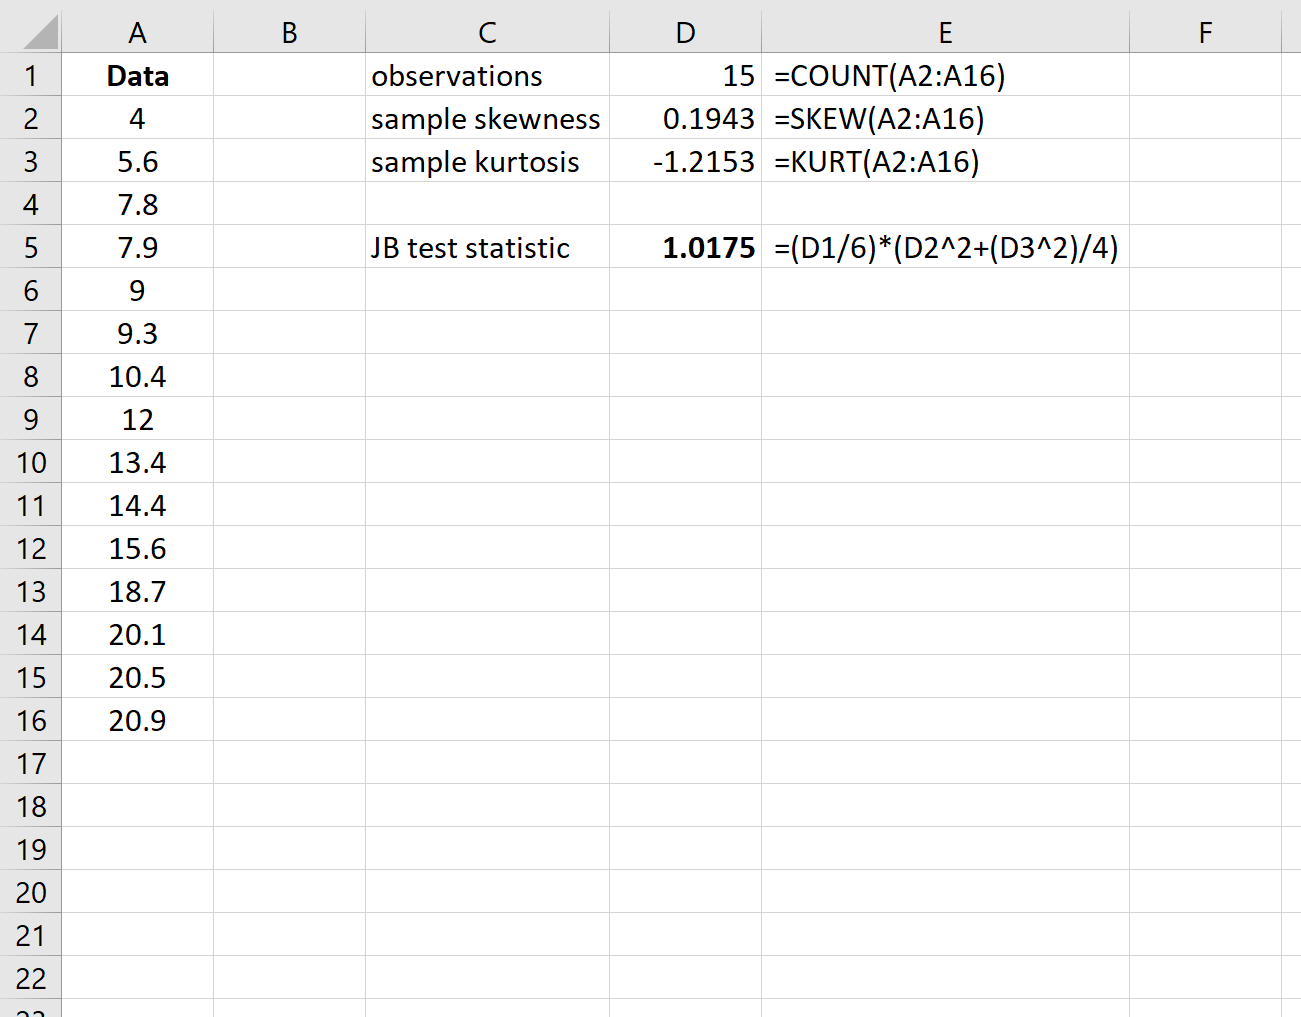
Next, calculate the JB test statistic. Column E shows the formulas used:
The test statistic turns out to be 1.0175.
Step 3: Calculate the P-Value
Under the null hypothesis of normality, the test statistic JB follows a Chi-Square distribution with 2 degrees of freedom.
So, to find the p-value for the test we will use the following function in Excel: =CHISQ.DIST.RT(JB test statistic, 2)
The p-value of the test is 0.601244. Since this p-value is not less than 0.05, we fail to reject the null hypothesis. We don’t have sufficient evidence to say that the dataset is not normally distributed.
In other words, we can assume that the data is normally distributed.
Additional Resources
How to Create a Q-Q Plot in Excel
How to Perform a Chi-Square Goodness of Fit Test in Excel


