A nested ANOVA is a type of ANOVA (“analysis of variance”) in which at least one factor is nested inside another factor.
For example, suppose a researcher wants to know if three different fertilizers produce different levels of plant growth.
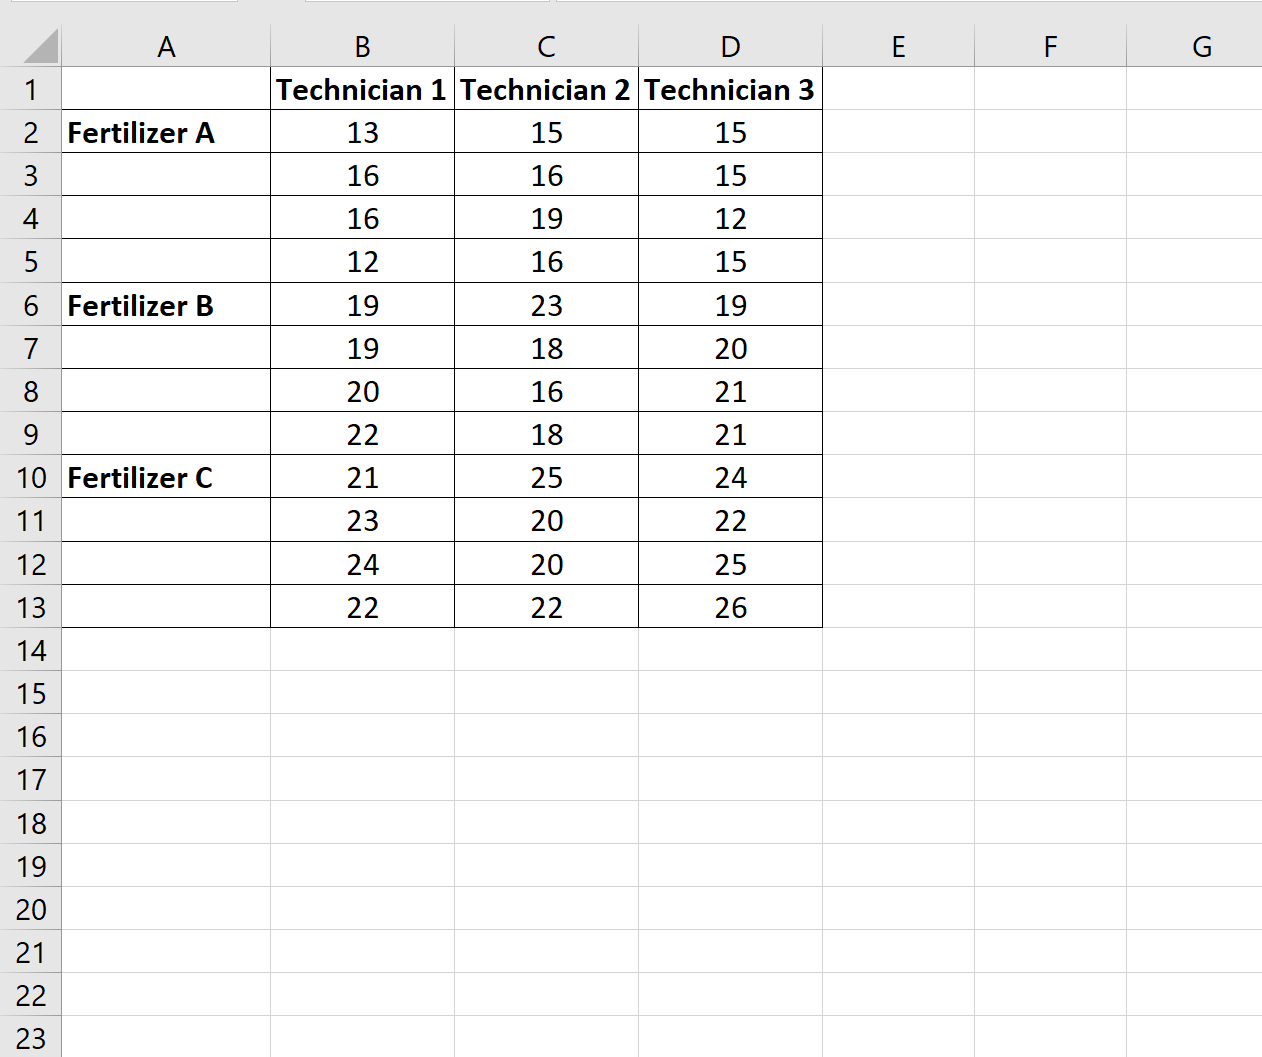
To test this, he has three different technicians sprinkle fertilizer A on four plants each, another three technicians sprinkle fertilizer B on four plants each, and another three technicians sprinkle fertilizer C on four plants each.
In this scenario, the response variable is plant growth and the two factors are technician and fertilizer. It turns out that technician is nested within fertilizer:
The following step-by-step example shows how to perform this nested ANOVA in Excel.
Step 1: Enter the Data
First, let’s enter the data in the following format:
Step 2: Fit the Nested ANOVA
There is no built-in Nested ANOVA function in Excel, but we can use the Anova: Two-Factor With Replication option from the Data Analysis ToolPak to perform a nested ANOVA with some tweaks.
To do so, click the Data tab along the top ribbon. Then click the Data Analysis button within the Analyze group:
If you don’t see this option, you need to first load the Data Analysis ToolPak in Excel.
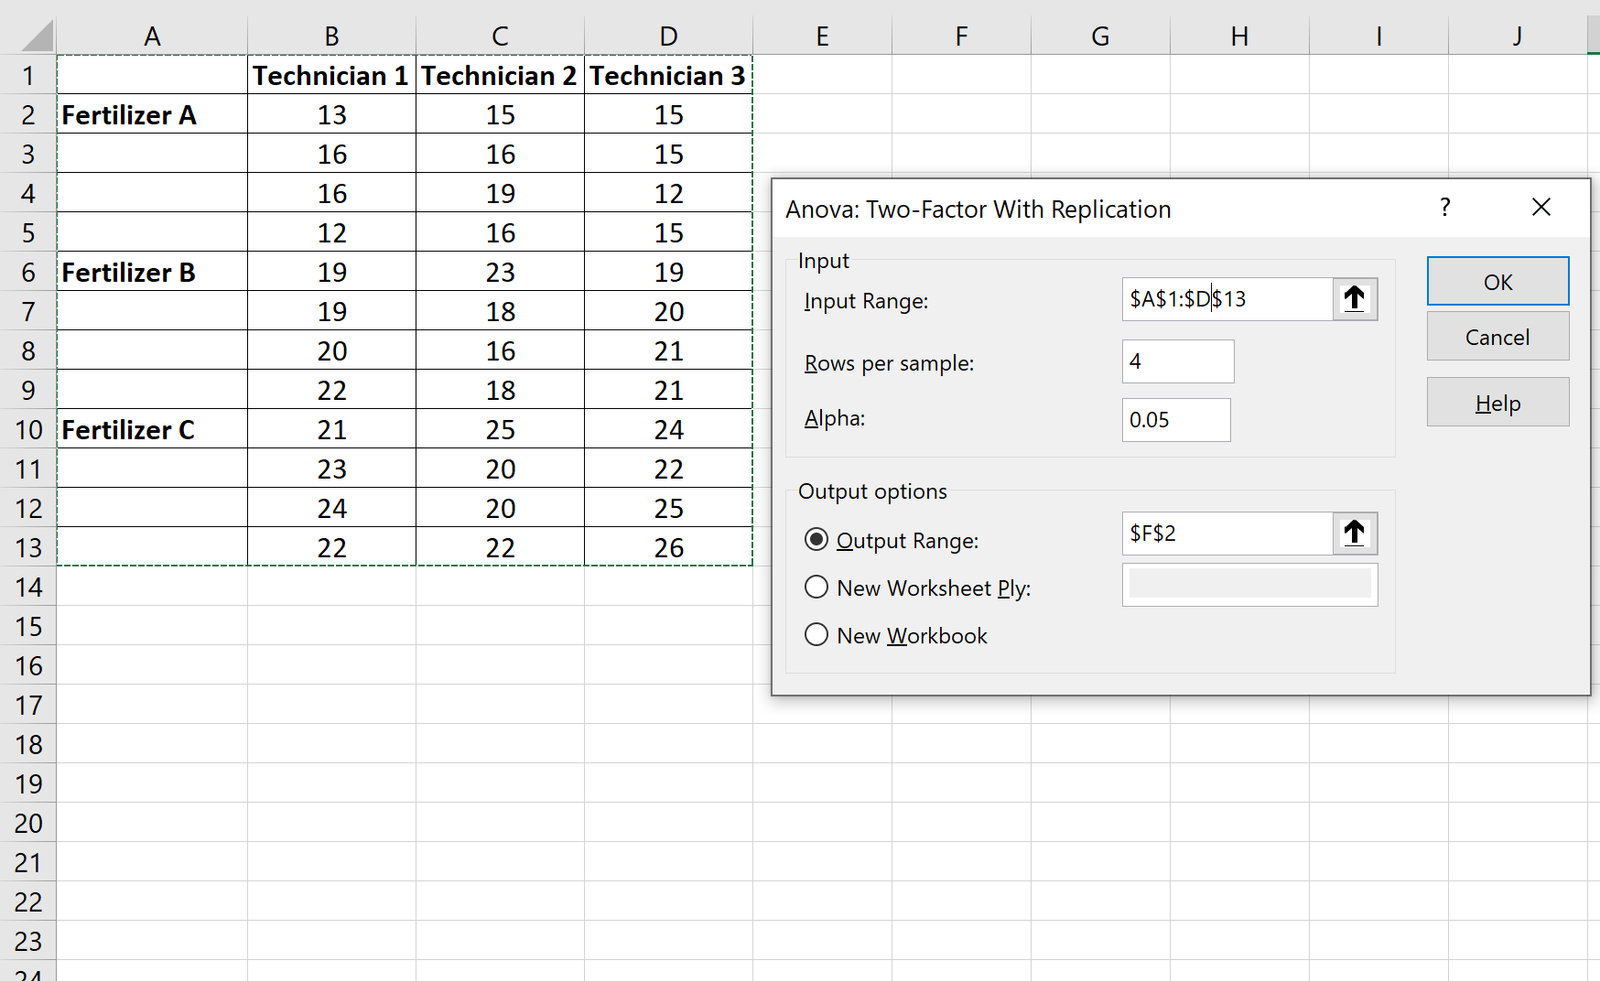
In the window that appears, click Anova: Two-Factor With Replication and then click OK. In the new window that appears, enter the following information:
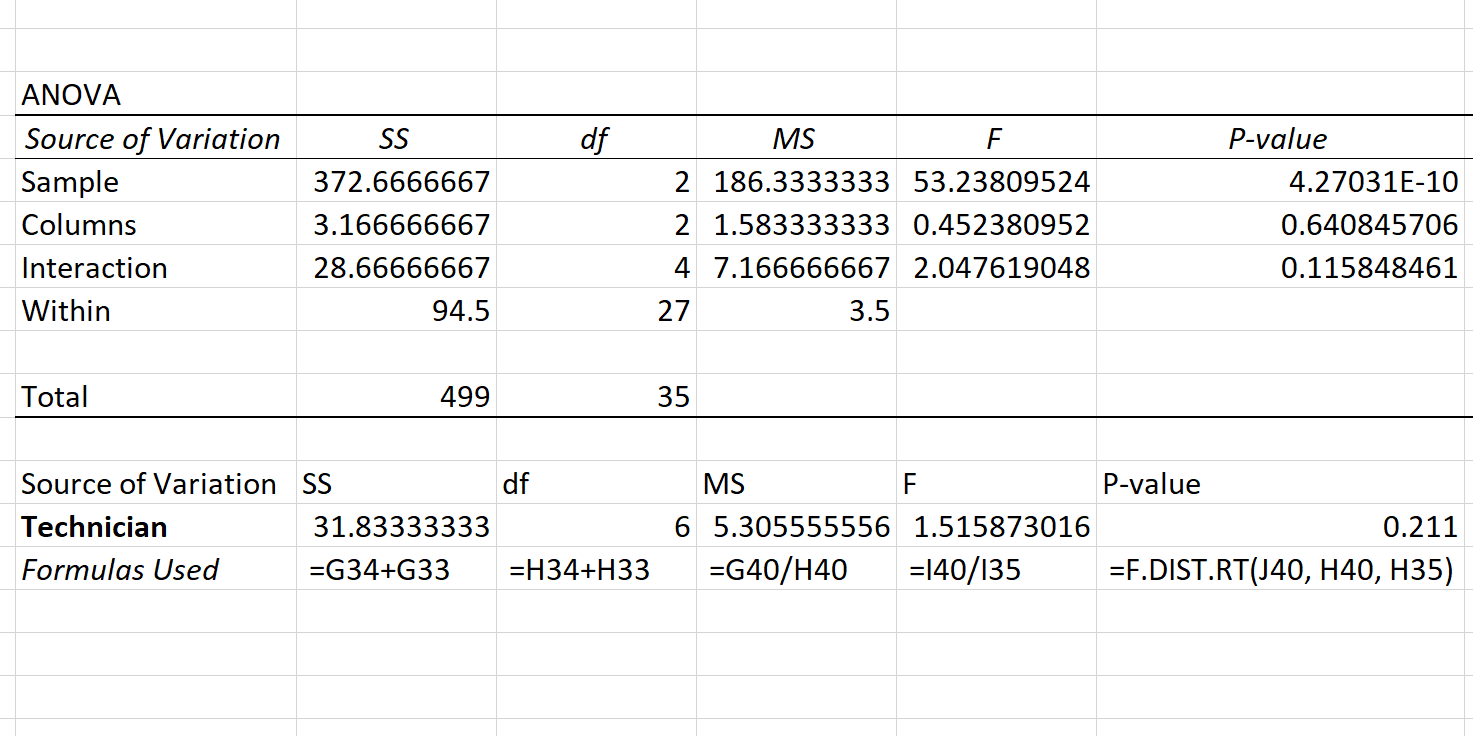
Once you click OK, the following output will appear:
Step 3: Interpret the Output
The ANOVA table shown at the bottom of the output is the one table that we will focus on.
The row labeled Sample shows the results for fertilizer. The p-value in this row (4.27031E-10) is less than .05, so we can conclude that fertilizer is statistically significant.
To determine if the nested factor “technician” is statistically significant, we must perform the following manual calculations:
The p-value turns out to be 0.211. Since this is not less than .05, we conclude that technician is not a statistically significant predictor of plant growth.
These results tell us that if we’d like to increase plant growth, we should focus on the fertilizer being used rather than the individual technician who is sprinkling the fertilizer.
Additional Resources
How to Perform a One-Way ANOVA in Excel
How to Perform a Two-Way ANOVA in Excel
How to Perform a Repeated Measures ANOVA in Excel


