A boxplot (sometimes called a box-and-whisker plot) is a plot that shows the five-number summary of a dataset.
The five-number summary includes:
- The minimum value
- The first quartile
- The median value
- The third quartile
- The maximum value
This tutorial explains how to plot multiple boxplots in one plot in R, using base R and ggplot2.
Boxplots in Base R
To illustrate how to create boxplots in base R, we’ll work with the built-in airquality dataset in R:
#view first 6 rows of "airquality" dataset
head(airquality)

# Ozone Solar.R Wind Temp Month Day
#1 41   190     7.4   67   5     1
#2 36   118     8.0   72   5     2
#3 12   149     12.6  74   5     3
#4 18   313     11.5  62   5     4
#5 NA   NA      14.3  56   5     5
#6 28   NA      14.9  66   5     6
To create a single boxplot for the variable “Ozone”, we can use the following syntax:
#create boxplot for the variable "Ozone"
boxplot(airquality$Ozone)
This generates the following boxplot:

Suppose we instead want to generate one boxplot for each month in the dataset. The following syntax shows how to do so:
#create boxplot that displays temperature distribution for each month in the dataset
boxplot(Temp~Month,
data=airquality,
main="Temperature Distribution by Month",
xlab="Month",
ylab="Degrees (F)",
col="steelblue",
border="black"
)
This generates the following chart that displays one boxplot for each month:

Boxplots in ggplot2
Another way to create boxplots in R is by using the package ggplot2. We’ll use the built-in dataset airquality again for the following examples.
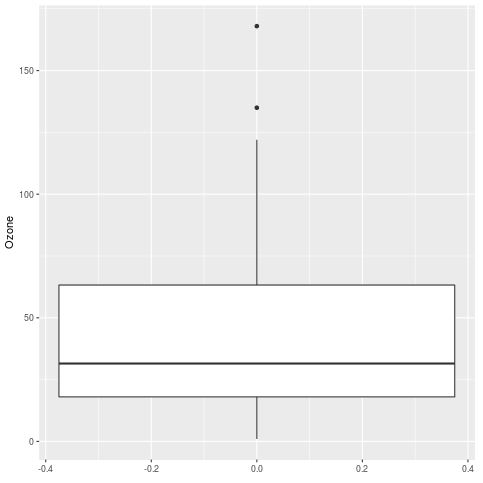
To create a single boxplot for the variable “Ozone” in the airquality dataset, we can use the following syntax:
#create boxplot for the variable "Ozone"
library(ggplot2)

ggplot(data = airquality, aes(y=Ozone)) + geom_boxplot()
This generates the following boxplot:
If instead we want to generate one boxplot for each month in the dataset, we can use thee following syntax to do so:
#create boxplot that displays temperature distribution for each month in the dataset
library(ggplot2)

ggplot(data = airquality, aes(x=as.character(Month), y=Temp)) +
    geom_boxplot(fill="steelblue") +
    labs(title="Temperature Distribution by Month", x="Month", y="Degrees (F)")
This generates the following chart that displays one boxplot for each month:

Additional Resources
The following tutorials offer additional information about boxplots:
When Should You Use a Box Plot? (3 Scenarios)
How to Identify Skewness in Box Plots
How to Compare Box Plots