In statistics, a monotonic relationship between two variables refers to a scenario where a change in one variable is generally associated with a change in a specific direction in another variable.
There are two types of monotonic relationships:
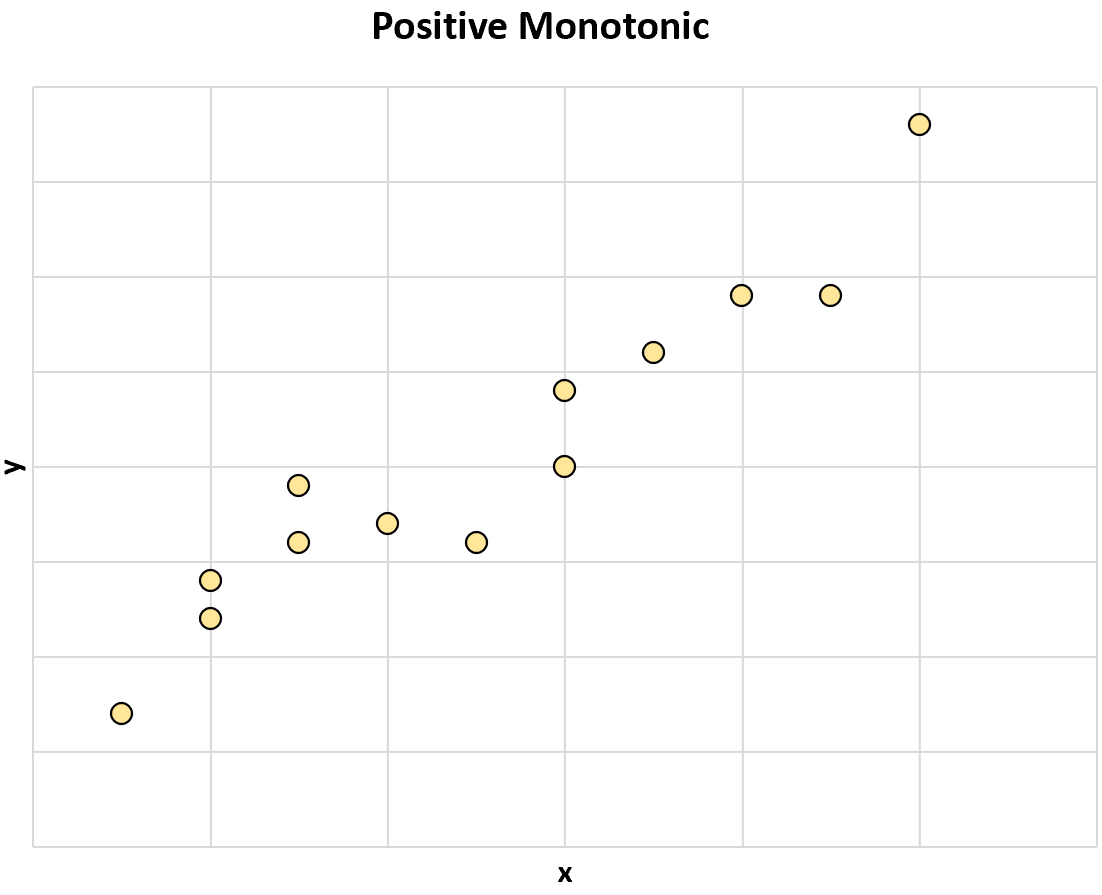
Positive Monotonic: When the value of one variable increases, the value of the other variable tends to increase as well.
Negative Monotonic: When the value of one variable increases, the value of the other variable tends to decrease.

If two variables don’t generally change in the same direction , then they are said to have a non-monotonic relationship.
Here’s one example of a non-monotonic relationship between two variables:

And here’s another example of a non-monotonic relationship between two variables:

As the value of x increases, the value of y sometimes increases, but sometimes the value of y decreases.
Strictly Monotonic vs. Non-Strictly Monotonic
Two variables are said to have a strictly monotonic relationship if changes in one variable are always associated with a change in the same direction in another variable.
For example, the following chart illustrates a strictly positive monotonic relationship between two variables:

When the value of x increases, the value of y always increases.
The following chart illustrates a strictly negative monotonic relationship between two variables:
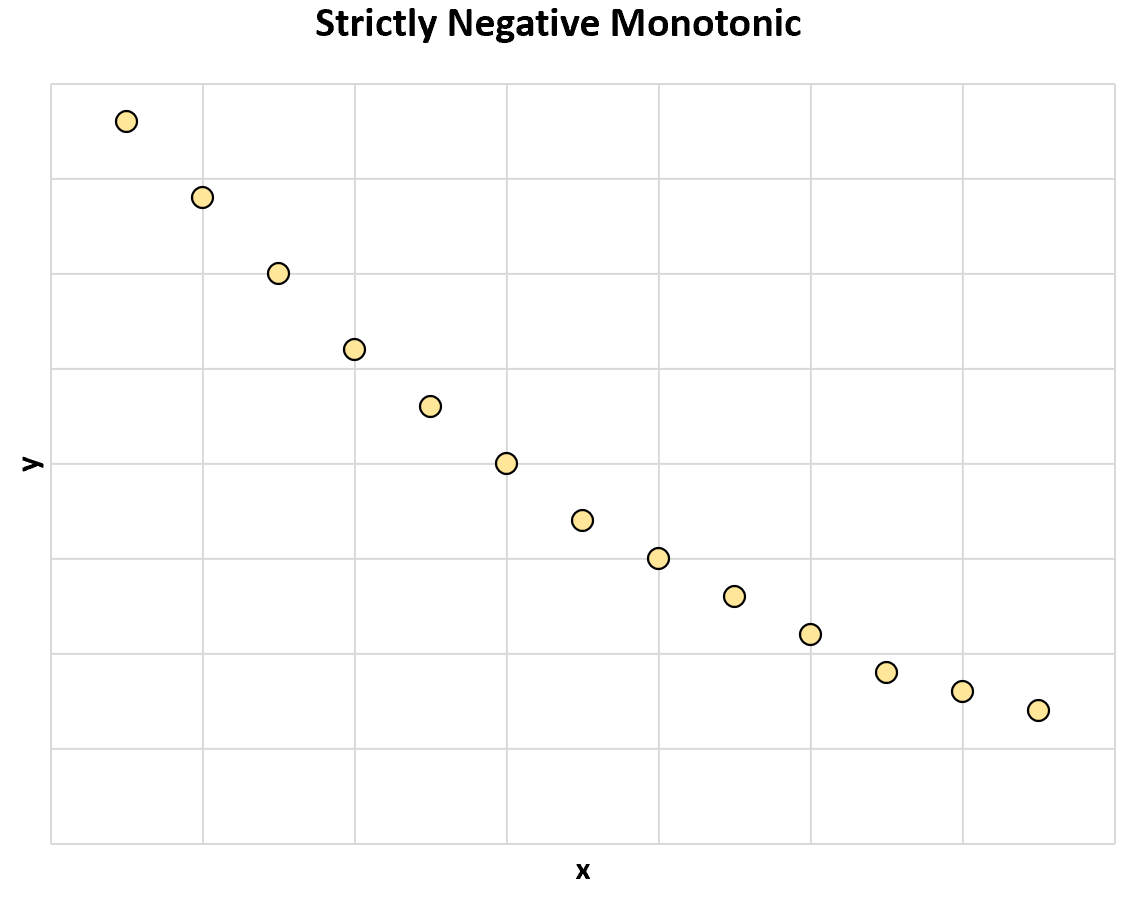
When the value of x increases, the value of y always decreases.
How to Quantify Monotonic Relationships
The most common way to quantify the relationship between two variables is to use the Pearson Correlation Coefficient, which measures the linear association between two variables.
This coefficient always takes on a value between -1 and 1 where:
- -1 indicates a perfectly negative linear correlation between two variables
- 0 indicates no linear correlation between two variables
- 1 indicates a perfectly positive linear correlation between two variables
The closer the coefficient is to 1, the stronger the positive relationship between two variables. Conversely, the closer the coefficient is to -1, the stronger the negative relationship between two variables.
However, if the relationship between two variables is monotonic but non-linear (like an exponential relationship) then it’s a good idea to use the Spearman Rank correlation, which was designed to handle monotonic relationships well.
No matter which type of correlation coefficient you calculate, it’s always a good idea to create a scatterplot to visualize the relationship between the variables as well.