Often we may want to calculate the mode of data that is grouped in some way.
Recall that the mode represents the value that occurs most frequently.
For example, suppose we have the following grouped data:
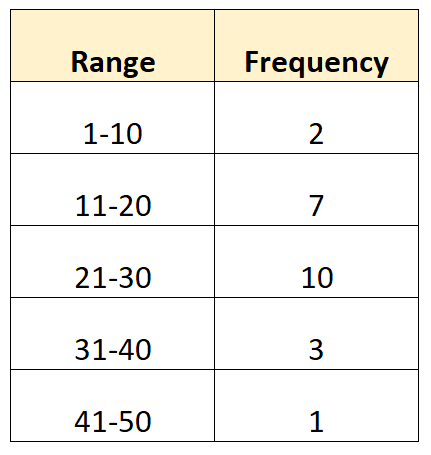
While it’s not possible to calculate the exact mode since we don’t know the raw data values, it is possible to estimate the mode using the following formula:
Mode of Grouped Data = L + W[(Fm – F1)/( (Fm-F1) + (Fm – F2) )]
where:
- L: Lower limit of modal class
- W: Width of modal class
- Fm: Frequency of modal class
- F1: Frequency of class immediately before modal class
- F2: Frequency of class immediately after modal class
Note: The modal class is simply the class with the highest frequency. In the example above, the modal class would be 21-30 since it has the highest frequency.
The following examples show how to calculate the mode of grouped data in different scenarios.
Example 1: Calculate the Mode of Grouped Data
Suppose we have the following frequency distribution that shows the exam scored receive by 40 students in a certain class:
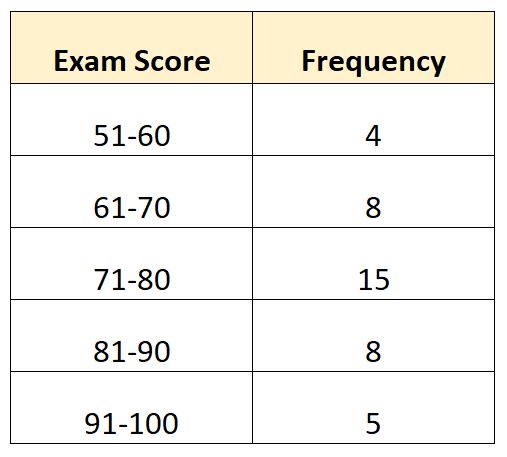
In this example, the modal class is 71-80.
Knowing this, we can calculate the following values:
- L: Lower limit of modal class: 71
- W: Width of modal class: 9
- Fm: Frequency of modal class: 15
- F1: Frequency of class immediately before modal class: 8
- F2: Frequency of class immediately after modal class: 8
We can plug these values into the formula to calculate the mode of the distribution:
- Mode = L + W[(Fm – F1)/( (Fm-F1) + (Fm – F2) )]
- Mode = 71 + 9[(15-8) / ( (15-8) + (15-8) )]
- Mode = 75.5
We estimate that the modal exam score is 75.5.
Example 2: Calculate the Mode of Grouped Data
Suppose we have the following frequency distribution that shows the number of points scored per game by 60 basketball players:
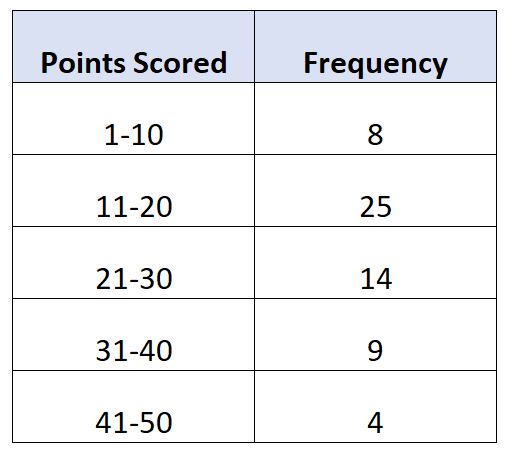
In this example, the modal class is 11-20.
Knowing this, we can calculate the following values:
- L: Lower limit of modal class: 11
- W: Width of modal class: 9
- Fm: Frequency of modal class: 25
- F1: Frequency of class immediately before modal class: 8
- F2: Frequency of class immediately after modal class: 14
We can plug these values into the formula to calculate the mode of the distribution:
- Mode = L + W[(Fm – F1)/( (Fm-F1) + (Fm – F2) )]
- Mode = 11 + 9[(25-8) / ( (25-8) + (25-14) )]
- Mode = 16.46
We estimate that the modal points scored is 16.46.
Additional Resources
The following tutorials explain how to perform other common operations with grouped data:
How to Find Mean & Standard Deviation of Grouped Data
How to Find the Median of Grouped Data
How to Calculate Percentile Rank for Grouped Data