Often we may want to calculate the median of data that is grouped in some way.
Recall that the median represents the value that lies directly in the middle of a dataset, when all of the values are arranged from smallest to largest.
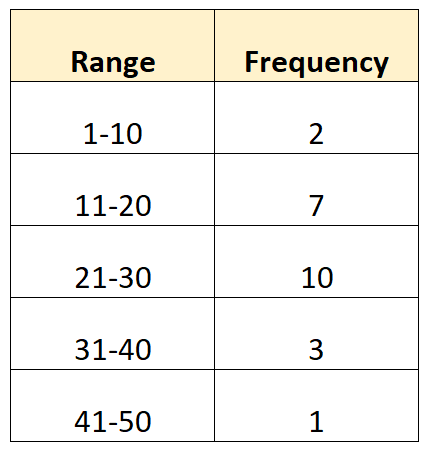
For example, suppose we have the following grouped data:
While it’s not possible to calculate the exact median since we don’t know the raw data values, it is possible to estimate the median using the following formula:
Median of Grouped Data = L + W[(N/2 – C) / F]
where:
- L: Lower limit of median class
- W: Width of median class
- N: Total Frequency
- C: Cumulative frequency up to median class
- F: Frequency of median class
Note: The median class is the class that contains the value located at N/2. In the example above, there are N = 23 total values. Thus, the median value is the one in position 23/2 = 11.5, which would be located in the class 21-30.
The following examples show how to calculate the median of grouped data in different scenarios.
Example 1: Calculate the Median of Grouped Data
Suppose we have the following frequency distribution that shows the exam scored receive by 40 students in a certain class:
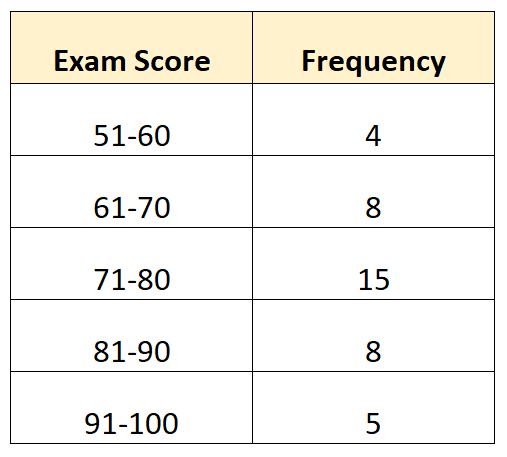
In this example, there are N = 40 total values. Thus, the median value lies in the class where 40/2 = 20 is located. The 20th largest value would be located in the 71-80 class.
Knowing this, we can calculate the following values:
- L: Lower limit of median class: 71
- W: Width of median class: 9
- N: Total Frequency: 40
- C: Cumulative frequency up to median class: 12
- F: Frequency of median class: 15
We can plug these values into the formula to calculate the median of the distribution:
- Median = L + W[(N/2 – C) / F]
- Median = 71 + 9[(40/2 – 12) / 15]
- Median = 75.8
We estimate that the median exam score is 75.8.
Example 2: Calculate the Median of Grouped Data
Suppose we have the following frequency distribution that shows the number of points scored per game by 60 basketball players:
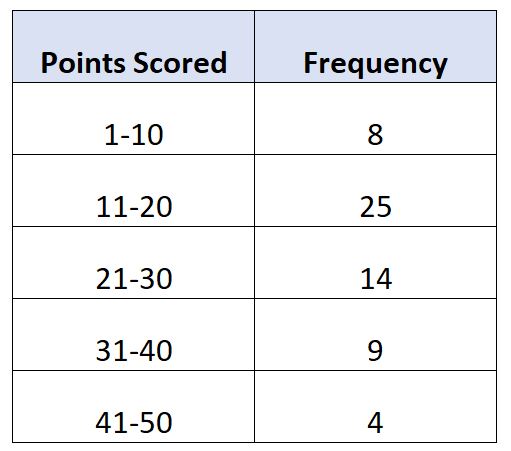
In this example, there are N = 60 total values. Thus, the median value lies in the class where 60/2 = 30 is located. The 30th largest value would be located in the 11-20 class.
Knowing this, we can calculate the following values:
- L: Lower limit of median class: 11
- W: Width of median class: 9
- N: Total Frequency: 60
- C: Cumulative frequency up to median class: 8
- F: Frequency of median class: 25
We can plug these values into the formula to calculate the median of the distribution:
- Median = L + W[(N/2 – C) / F]
- Median = 11 + 9[(60/2 – 8) / 25]
- Median = 18.92
We estimate that the median exam score is 18.92.
Additional Resources
The following tutorials explain how to perform other common operations with grouped data:
How to Find Mean & Standard Deviation of Grouped Data
How to Find the Mode of Grouped Data
How to Calculate Percentile Rank for Grouped Data