You can use the following formula to perform a Median IF function in Google Sheets:
=MEDIAN(IF(GROUP_RANGE=VALUE, MEDIAN_RANGE))
This formula finds the median value of all cells in some range that belong to a certain group.
When you type this formula into a cell, you need to press Ctrl + Shift + Enter since this is an array formula.
The following example shows how to use this function in practice.
Example: Median IF Function in Google Sheets
Suppose we have the following dataset that shows the total points scored by 15 different basketball players:

Now suppose we’d like to find the median of the points scored by players on each team.
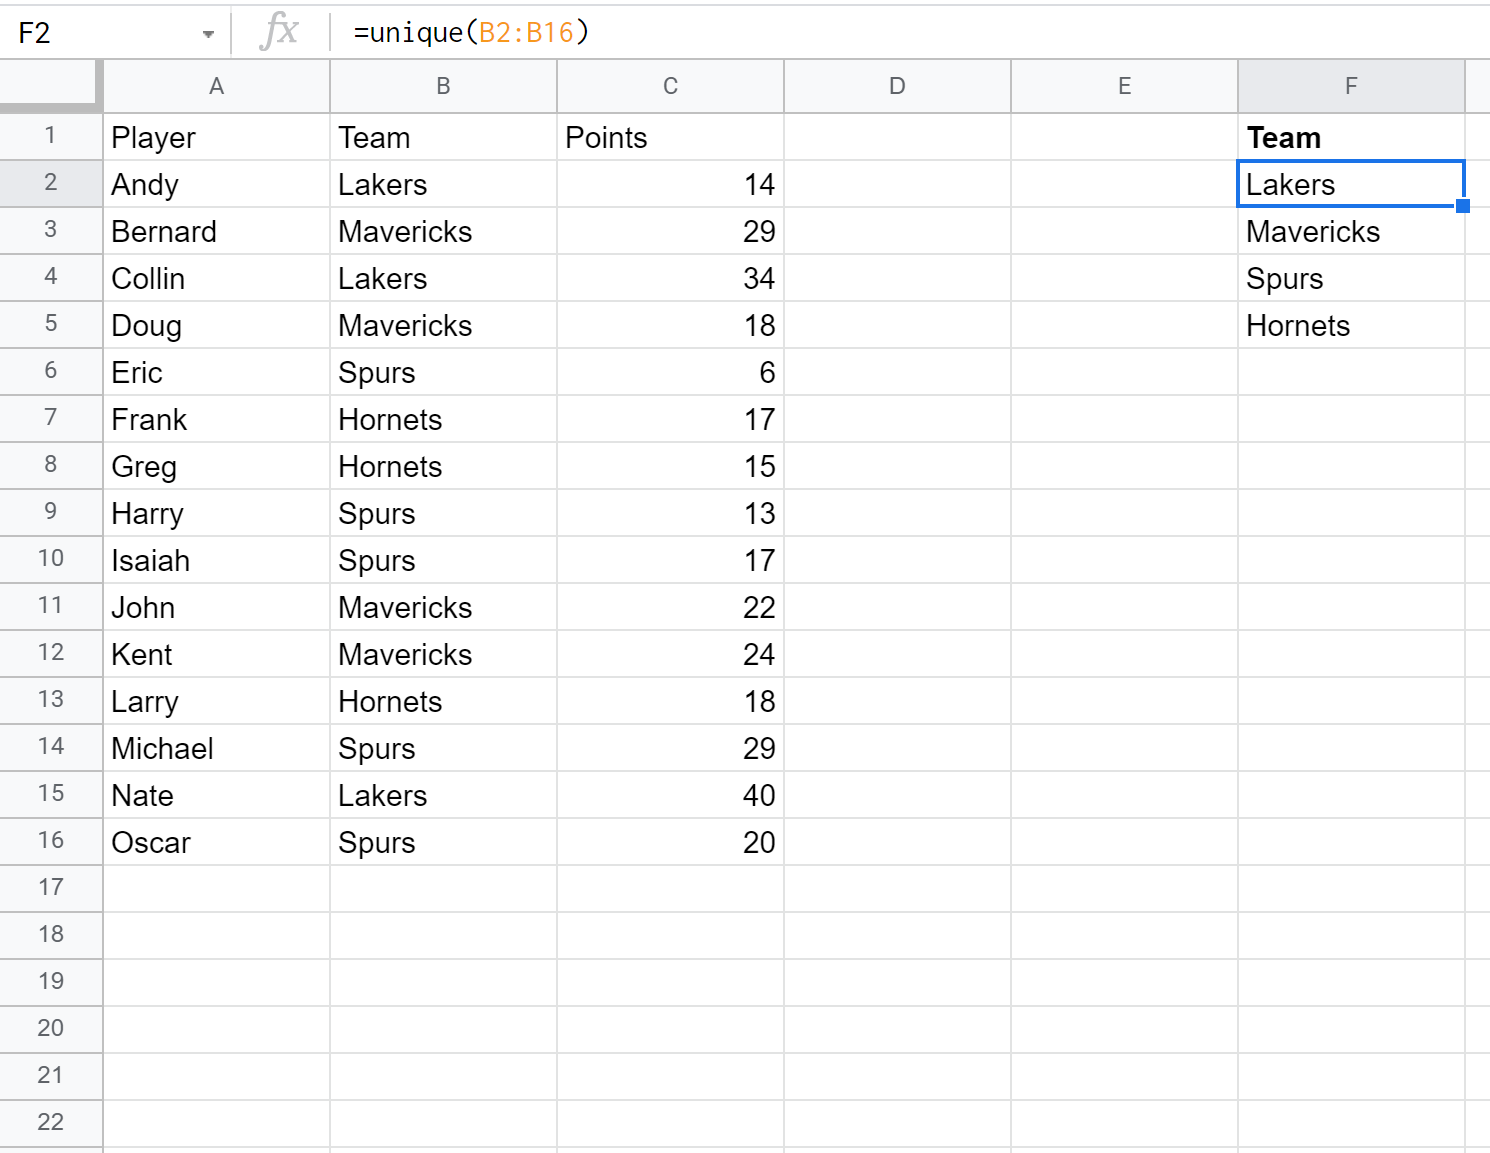
To do so, we can use the =UNIQUE() function to first create a list of the unique teams. We’ll type the following formula into cell F2:
=UNIQUE(B2:B16)
Once we press enter, a list of unique team names will be displayed:
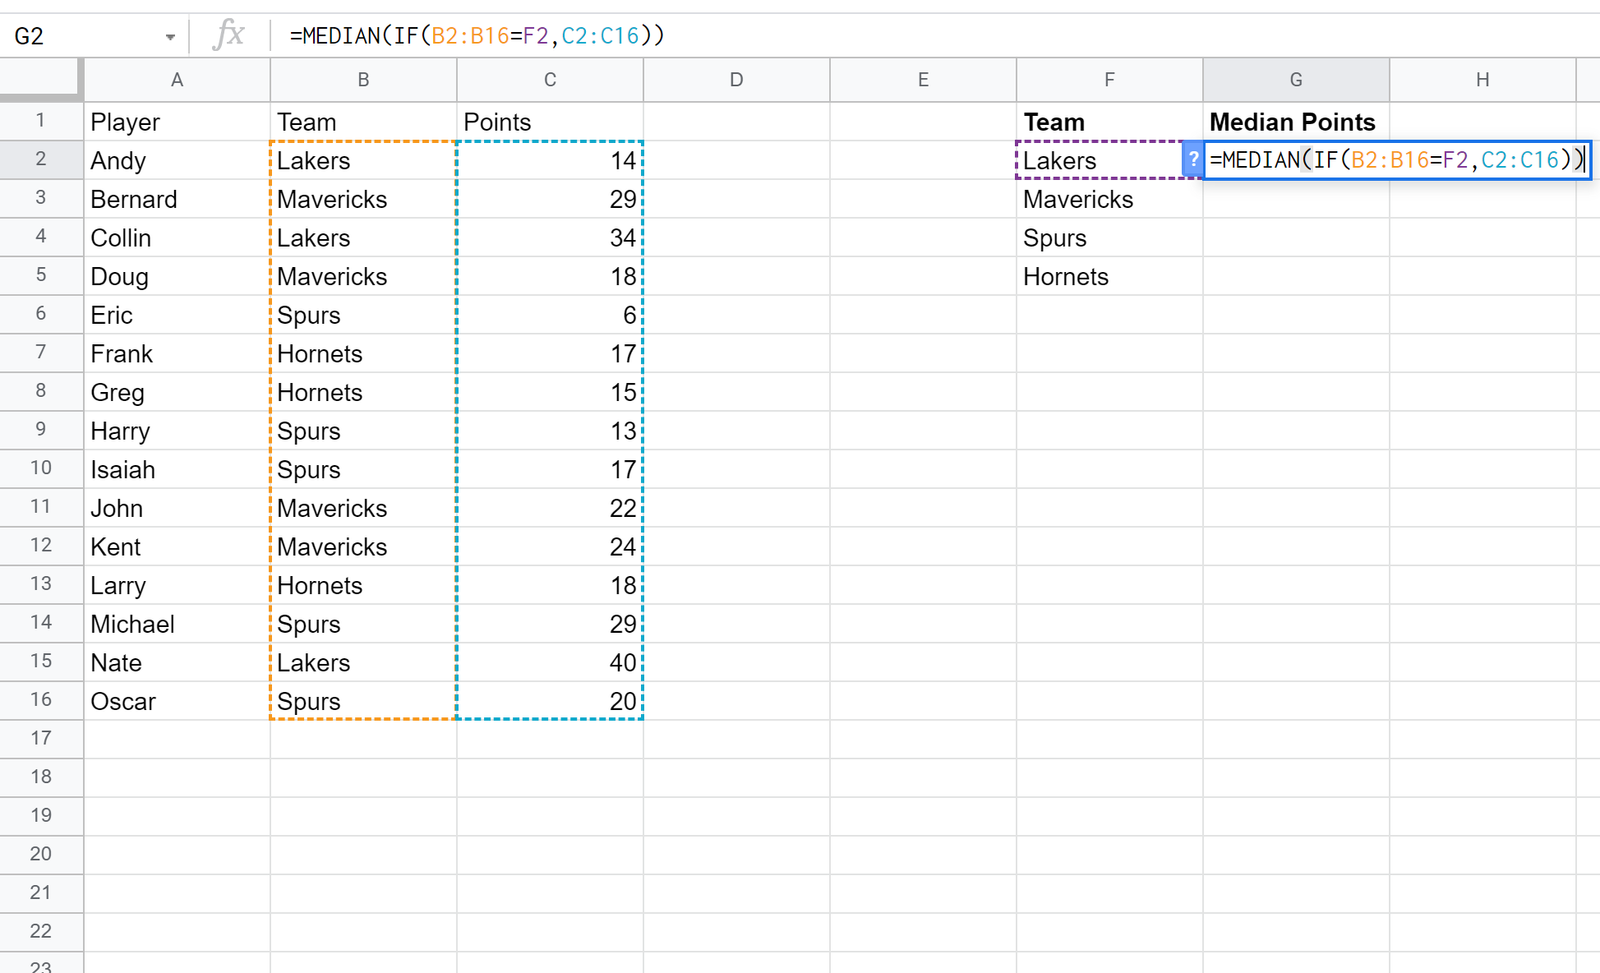
Next, we can use the =MEDIAN() function to find the median number of points scored by players on each team.
We’ll type the following formula into cell G2 and press Ctrl + Shift + Enter so Google Sheets knows this is an array formula:
=MEDIAN(IF(B2:B16=F2, C2:C16))
We’ll then copy and paste this formula into the remaining cells in column G:

That’s it!
Column F displays each of the unique teams and column G displays the median of the points scored by players on each team.
Additional Resources
The following tutorials explain how to calculate other common metrics in Google Sheets:
How to Calculate Standard Deviation IF in Google Sheets
How to Calculate a Five Number Summary in Google Sheets
How to Calculate the Interquartile Range in Google Sheets
How to Calculate the Midrange in Google Sheets