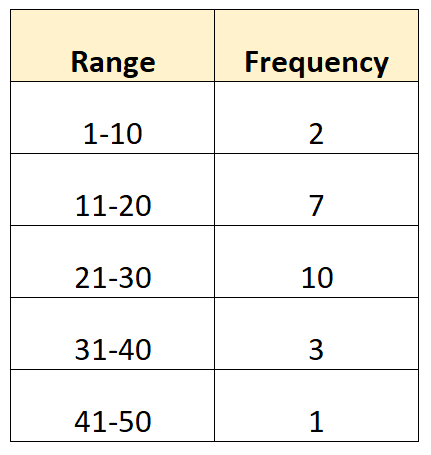
Often we may want to calculate the mean and standard deviation of data that is grouped in some way. For example, suppose we have the following grouped data:
While it’s not possible to calculate the exact mean and standard deviation since we don’t know the raw data values, it is possible to estimate the mean and standard deviation.
The following steps explain how to do so.
Related: How to Find the Mode of Grouped Data
Calculate the Mean of Grouped Data
We can use the following formula to estimate the mean of grouped data:
Mean: Σmini / N
where:
- mi: The midpoint of the ith group
- ni: The frequency of the ith group
- N: The total sample size
Here’s how we would apply this formula to our dataset from earlier:
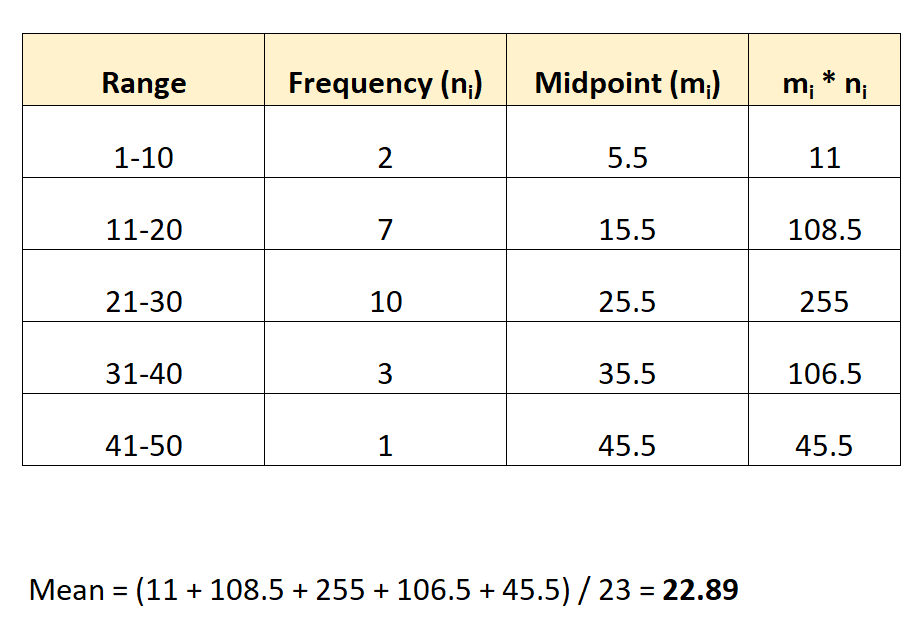
The mean of the dataset turns out to be 22.89.
Note: The midpoint for each group can be found by taking the average of the lower and upper value in the range. For example, the midpoint for the first group is calculated as: (1+10) / 2 = 5.5.
Calculate the Standard Deviation of Grouped Data
We can use the following formula to estimate the standard deviation of grouped data:
Standard Deviation: √Σni(mi-μ)2 / (N-1)
where:
- ni: The frequency of the ith group
- mi: The midpoint of the ith group
- μ: The mean
- N: The total sample size
Here’s how we would apply this formula to our dataset:
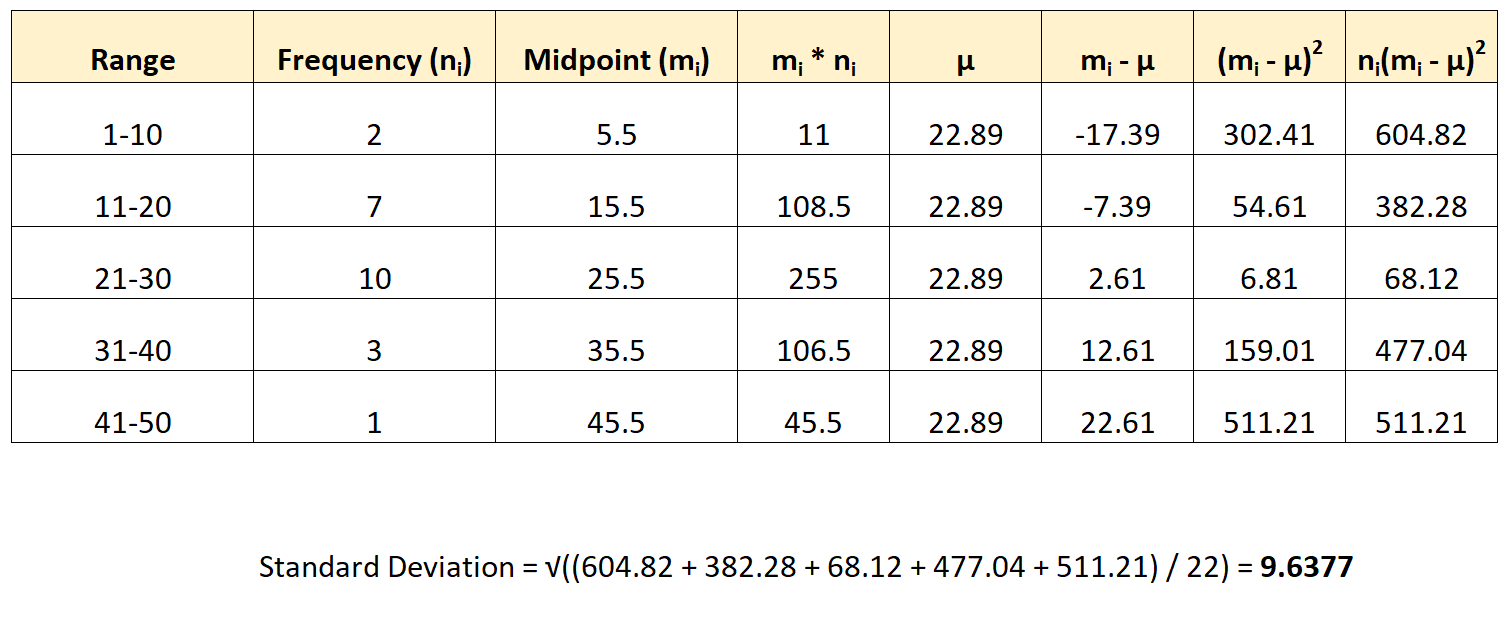 The standard deviation of the dataset turns out to be 9.6377.
Additional Resources
How to Estimate the Mean and Median of Any Histogram
How to Calculate Percentile Rank for Grouped Data
How to Find the Median of Grouped Data