You can use the following formulas to find the mean, median, and mode of a dataset in Excel:
=AVERAGE(A1:A10)

=MEDIAN(A1:A10)

=MODE.MULT(A1:A10)
It’s worth noting that each of these formulas will simply ignore non-numeric or blank values when calculating these metrics for a range of cells in Excel.
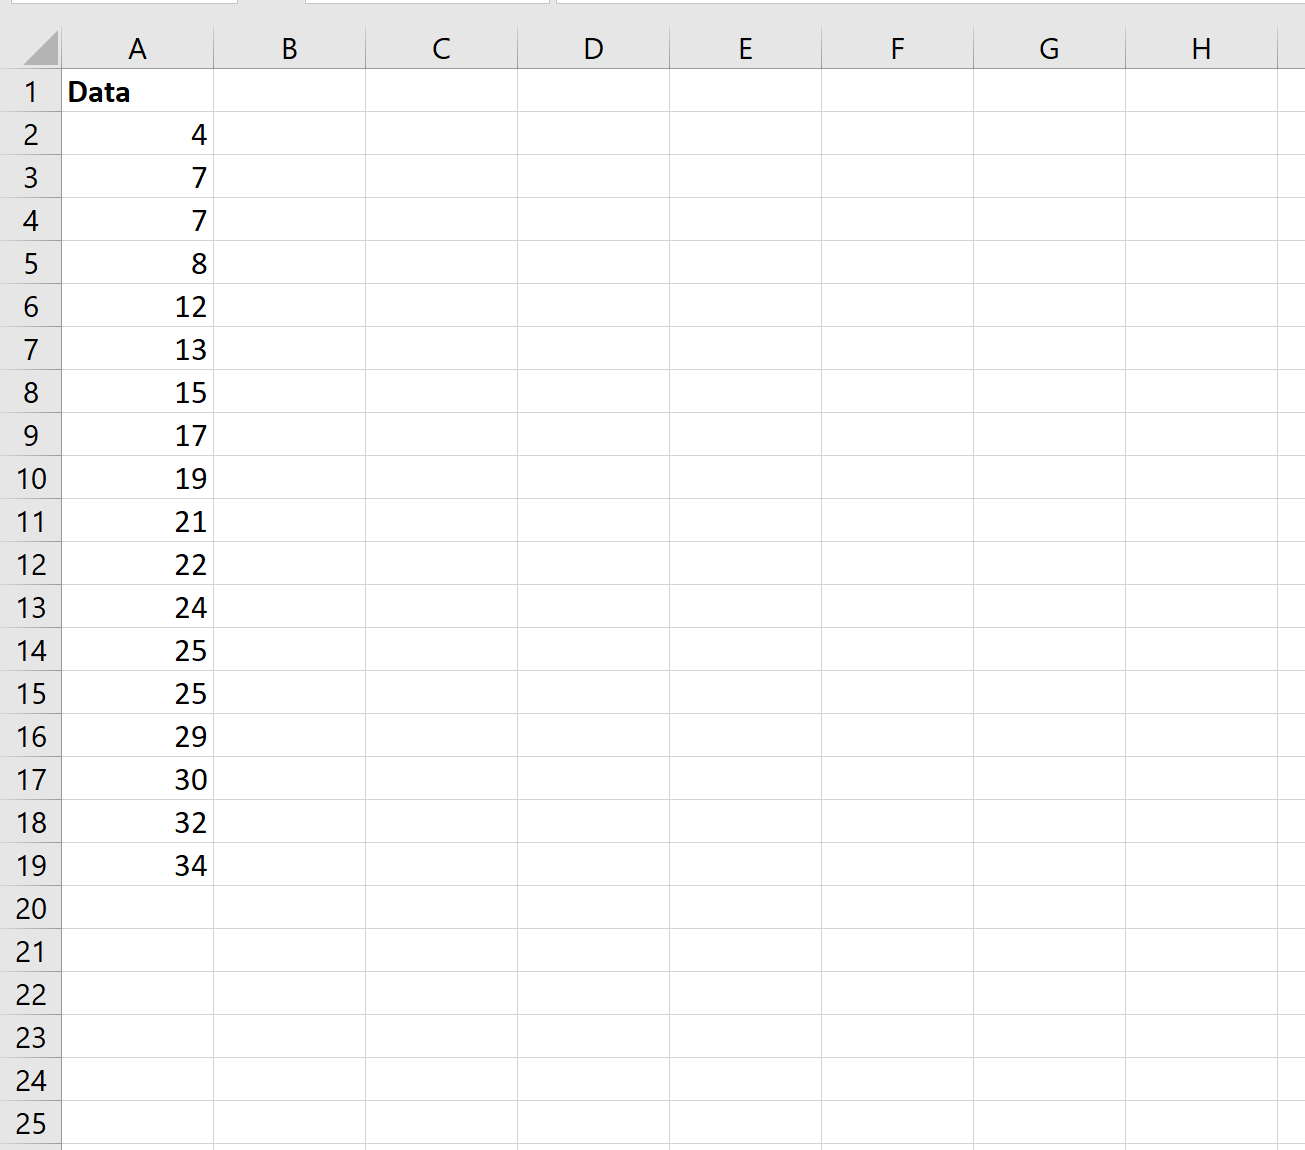
The following examples shows how to use these formulas in practice with the following dataset:
Example: Finding the Mean in Excel
The mean represents the average value in a dataset.
The following screenshot shows how to calculate the mean of a dataset in Excel:
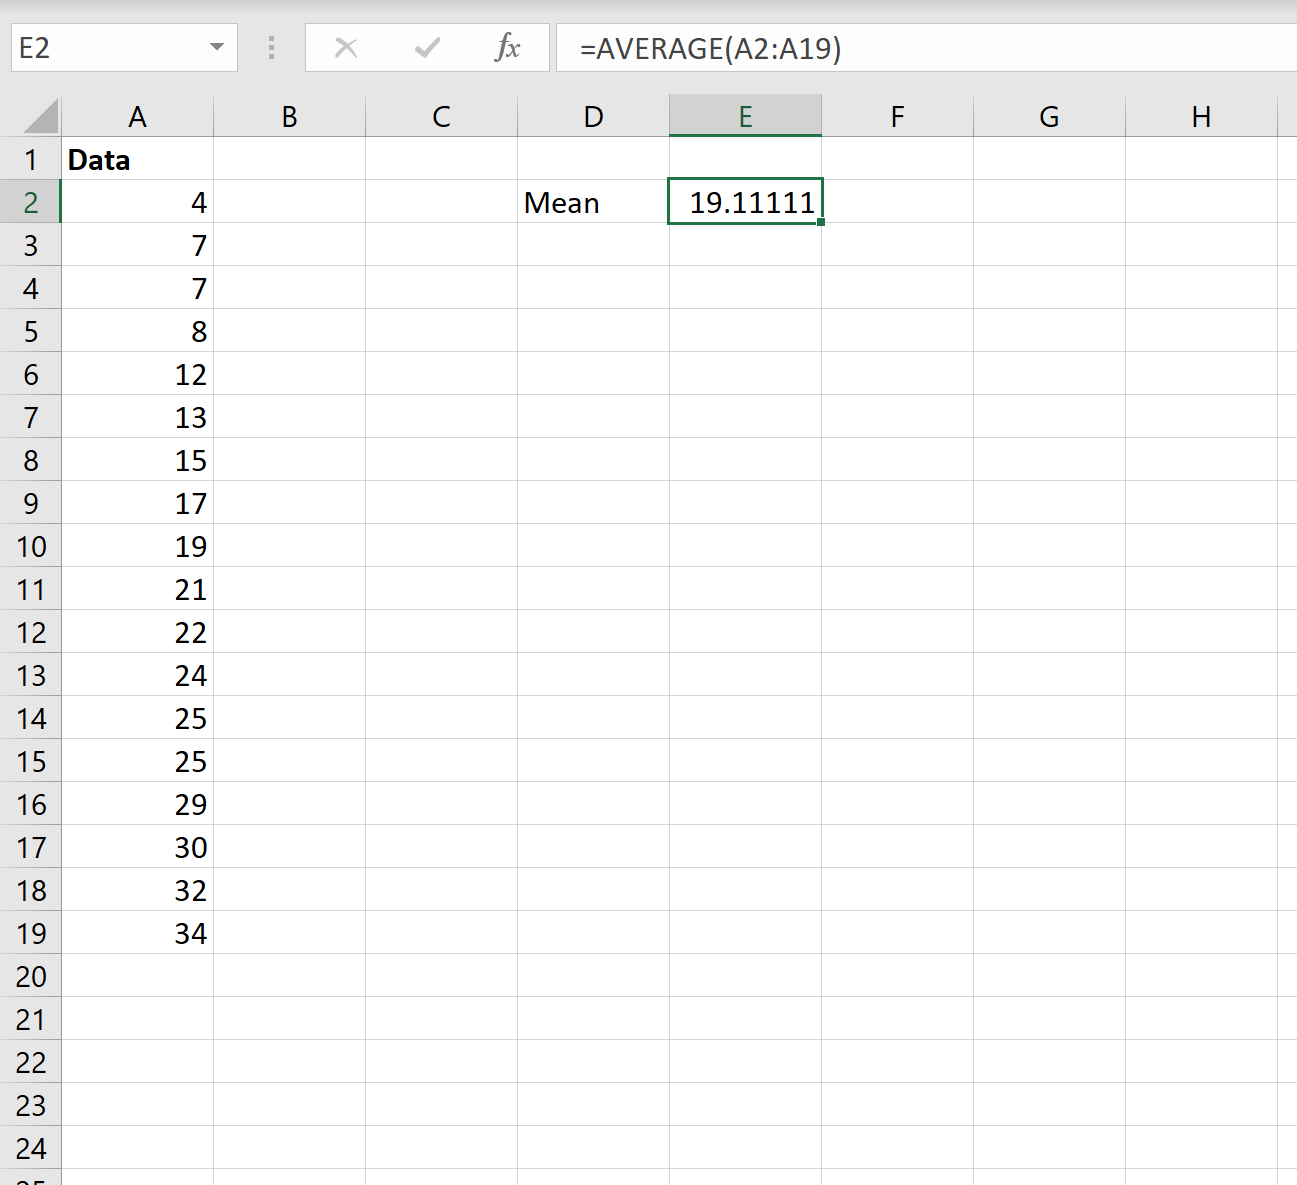
The mean turns out to be 19.11.
Example: Finding the Median in Excel
The median represents the middle value in a dataset, when all of the values are arranged from smallest to largest.
The following screenshot shows how to calculate the median of a dataset in Excel:
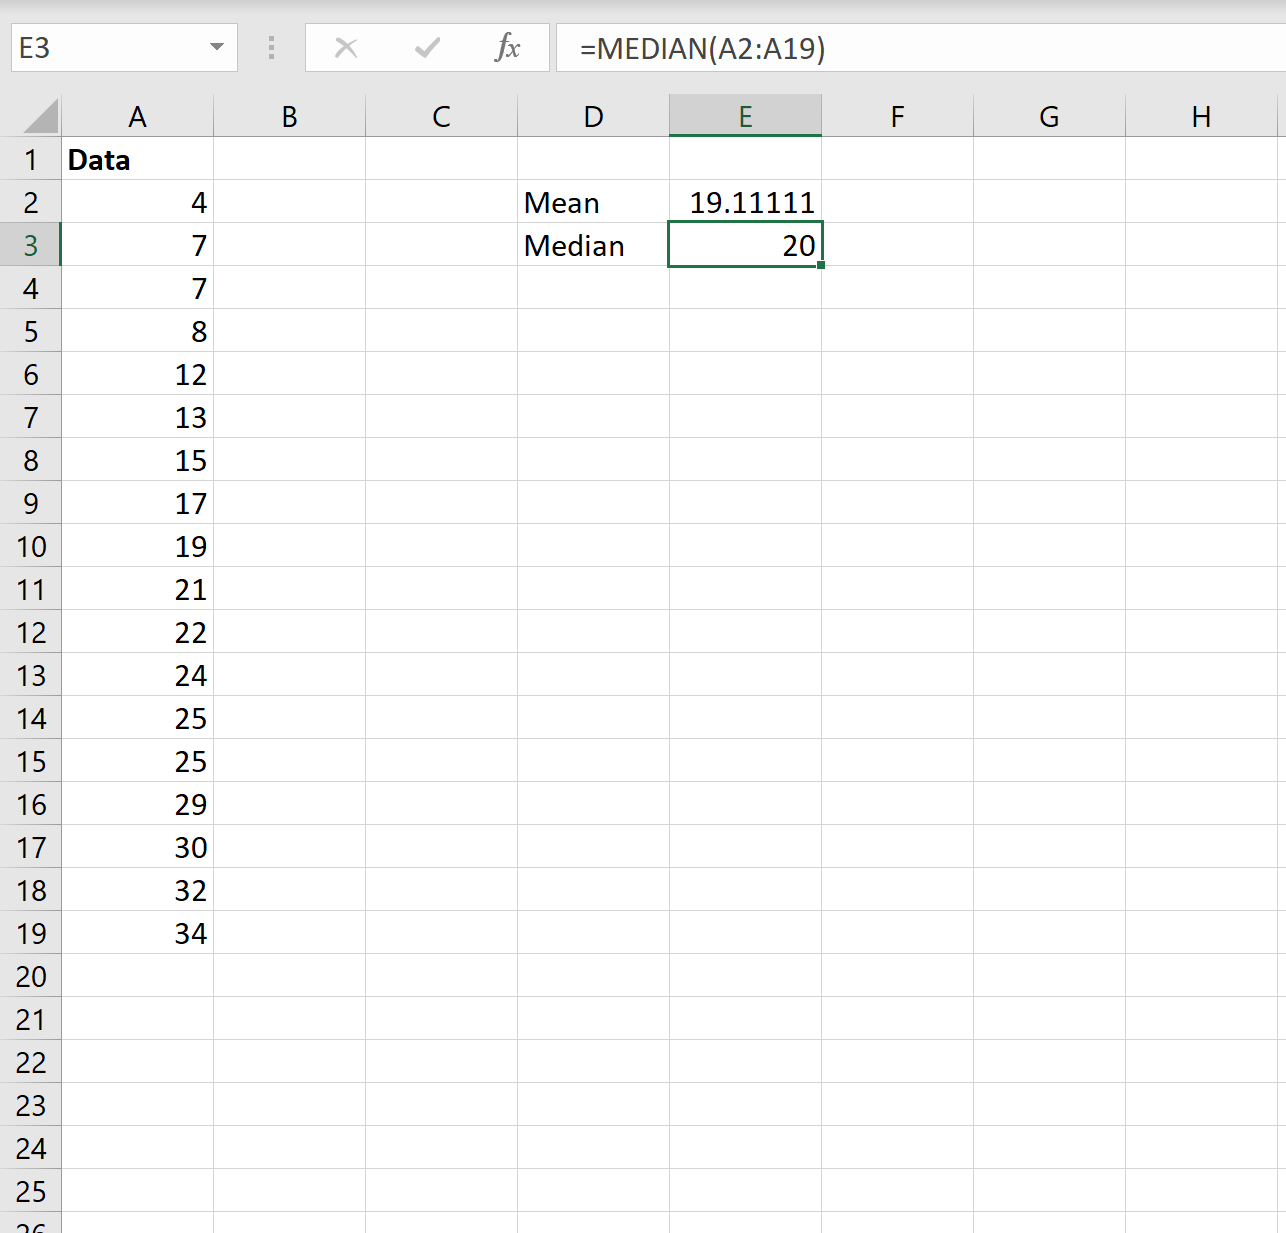
The median turns out to be 20.
Example: Finding the Mode in Excel
The mode represents the value that occurs most often in a dataset. Note that a dataset can have no mode, one mode, or multiple modes.
The following screenshot shows how to calculate the mode(s) of a dataset in Excel:
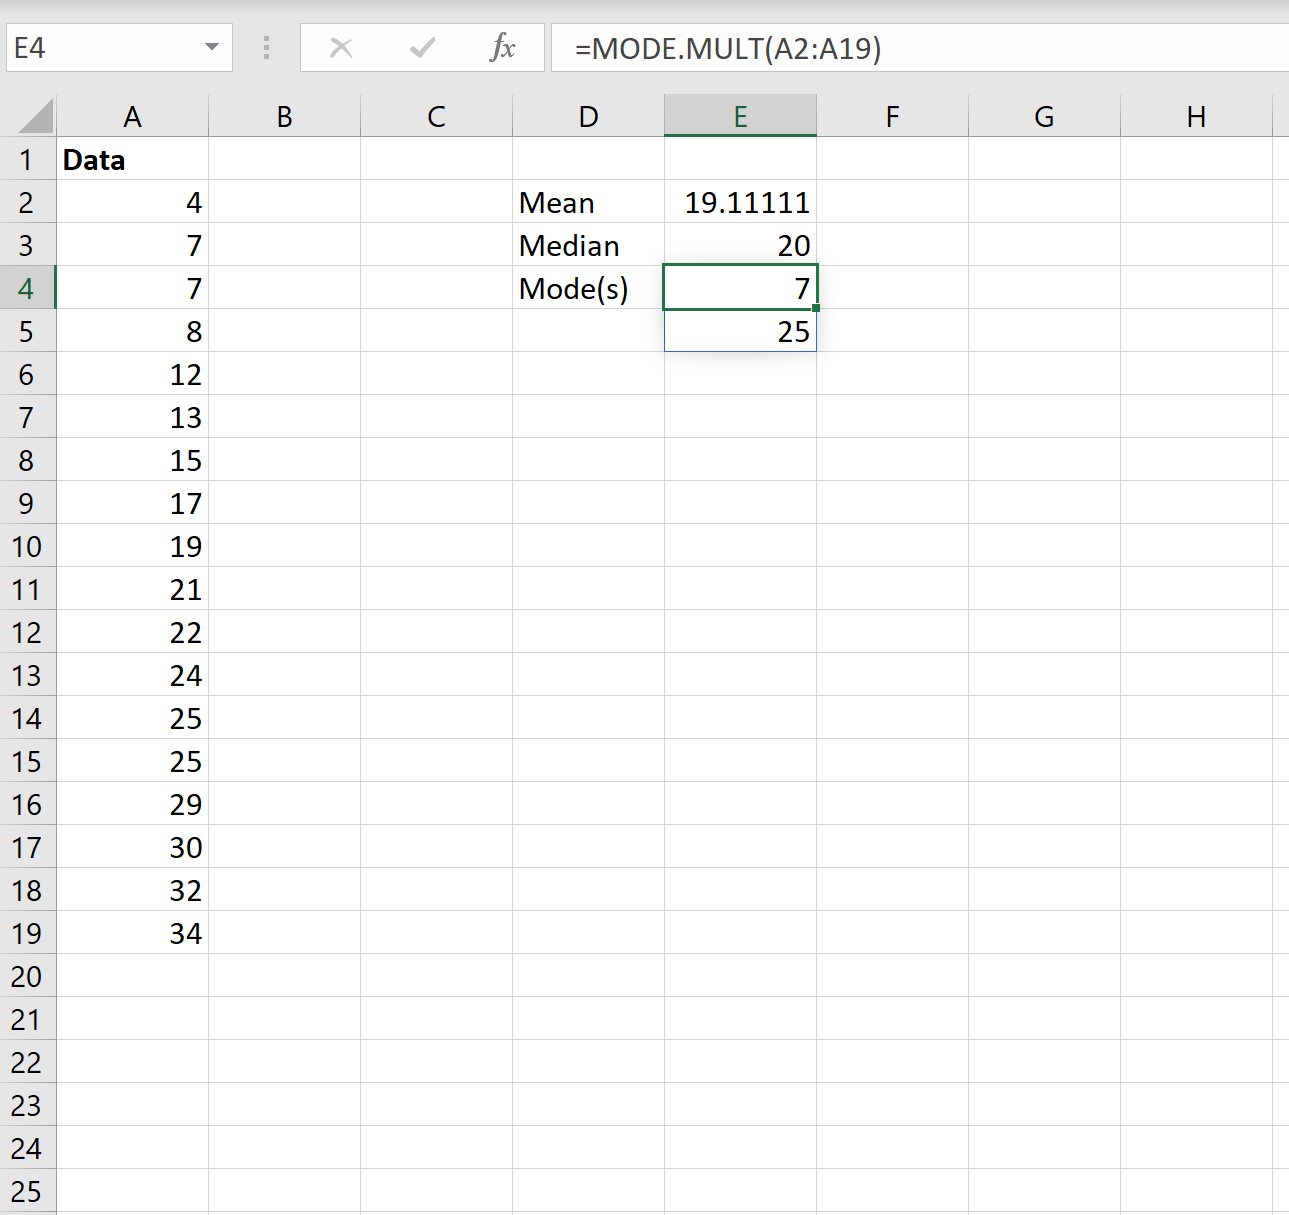
The modes turn out to be 7 and 25. Each of these values appears twice in the dataset, which is more often than any other value occurs.
Note: If you use the =MODE() function instead, it will only return the first mode. For this dataset, only the value 7 would be returned. For this reason, it’s always a good idea to use the =MODE.MULT() function in case there happens to be more than one mode in the dataset.
Additional Resources
How to Calculate the Interquartile Range (IQR) in Excel
How to Calculate the Midrange in Excel
How to Calculate Standard Deviation in Excel