You can use the following basic syntax to add a trendline to a plot in Matplotlib:
#create scatterplot
plt.scatter(x, y)

#calculate equation for trendline
z = np.polyfit(x, y, 1)
p = np.poly1d(z)

#add trendline to plot
plt.plot(x, p(x))
The following examples show how to use this syntax in practice.
Example 1: Create Linear Trendline in Matplotlib
The following code shows how to create a basic trendline for a scatterplot in Matplotlib:
import numpy as np
import matplotlib.pyplot as plt

#define data
x = np.array([8, 13, 14, 15, 15, 20, 25, 30, 38, 40])
y = np.array([5, 4, 18, 14, 20, 24, 28, 33, 30, 37])

#create scatterplot
plt.scatter(x, y)

#calculate equation for trendline
z = np.polyfit(x, y, 1)
p = np.poly1d(z)

#add trendline to plot
plt.plot(x, p(x))
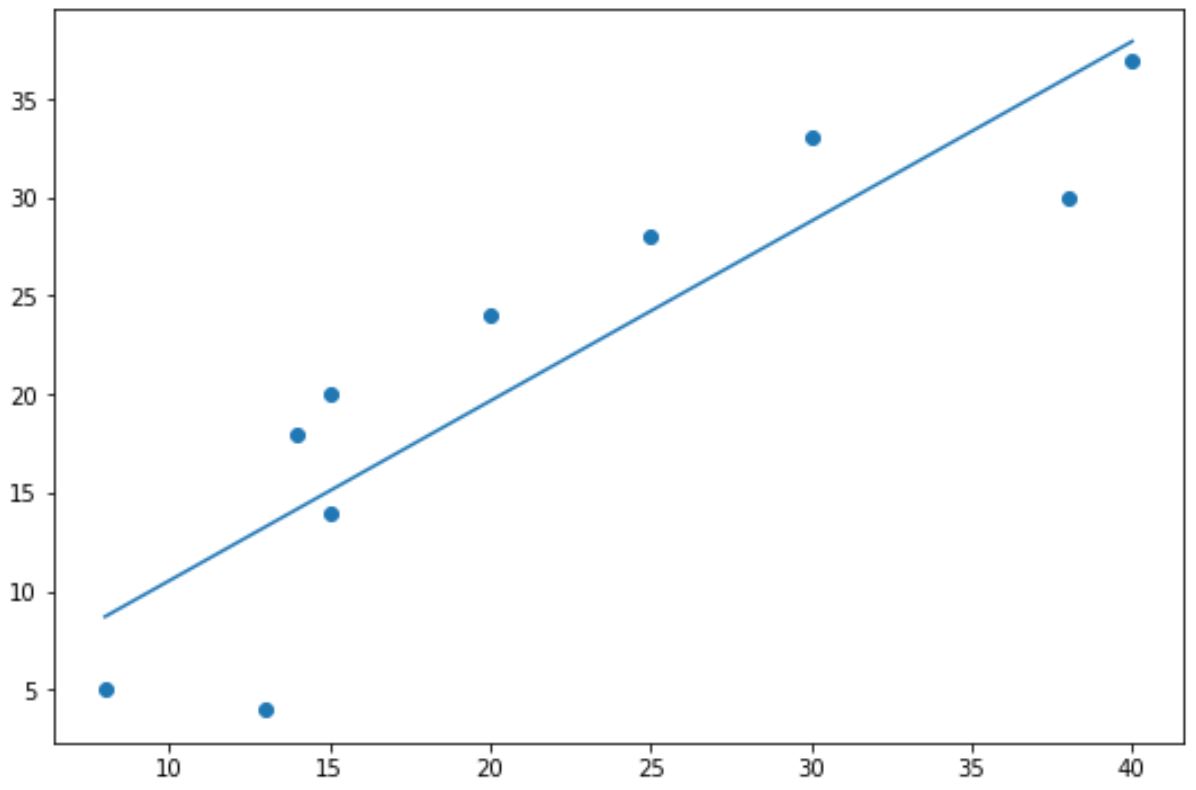
The blue dots represent the data points and the straight blue line represents the linear trendline.
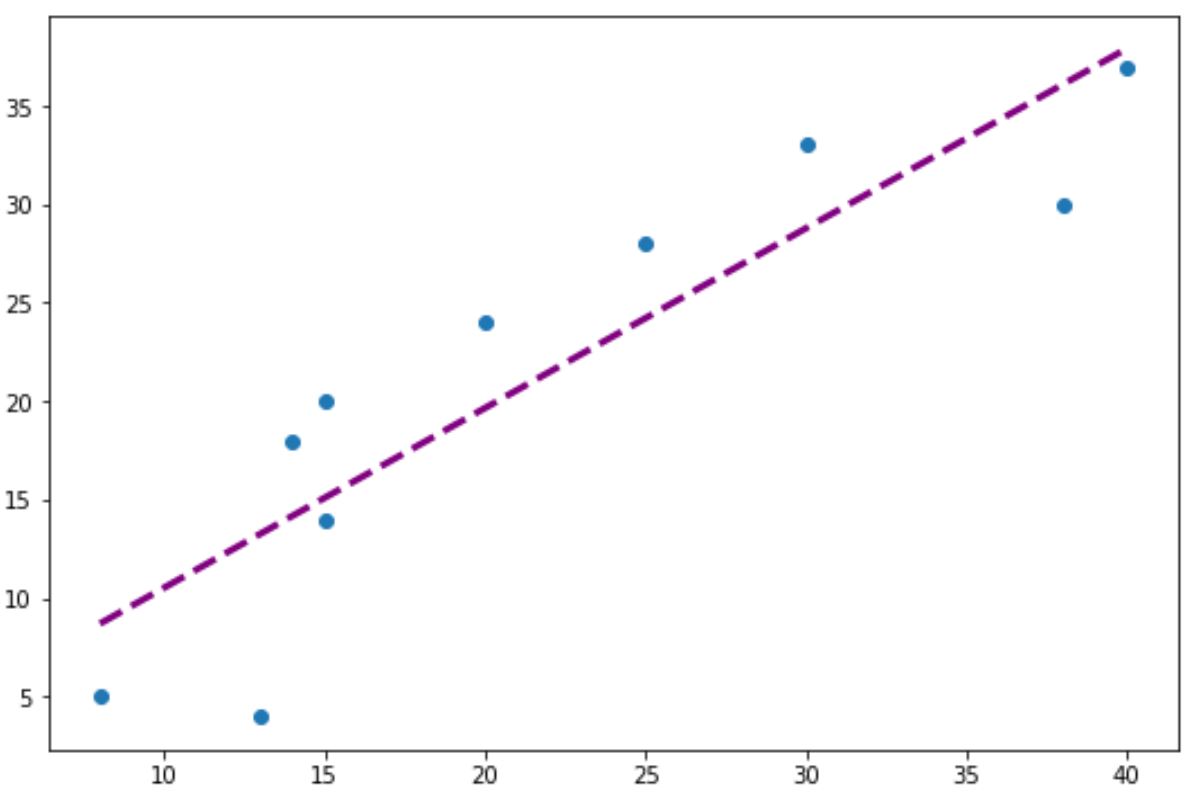
Note that you can also use the color, linewidth, and linestyle arguments to modify the appearance of the trendline:
#add custom trendline to plot
plt.plot(x, p(x), color="purple", linewidth=3, linestyle="--")
Example 2: Create Polynomial Trendline in Matplotlib
To create a polynomial trendline, simply change the value in the np.polyfit() function.
For example, we could use a value of 2 to create a quadratic trendline:
import numpy as np
import matplotlib.pyplot as plt

#define data
x = np.array([8, 13, 14, 15, 15, 20, 25, 30, 38, 40])
y = np.array([5, 4, 18, 14, 20, 24, 28, 33, 30, 37])

#create scatterplot
plt.scatter(x, y)

#calculate equation for quadratic trendline
z = np.polyfit(x, y, 2)
p = np.poly1d(z)

#add trendline to plot
plt.plot(x, p(x))
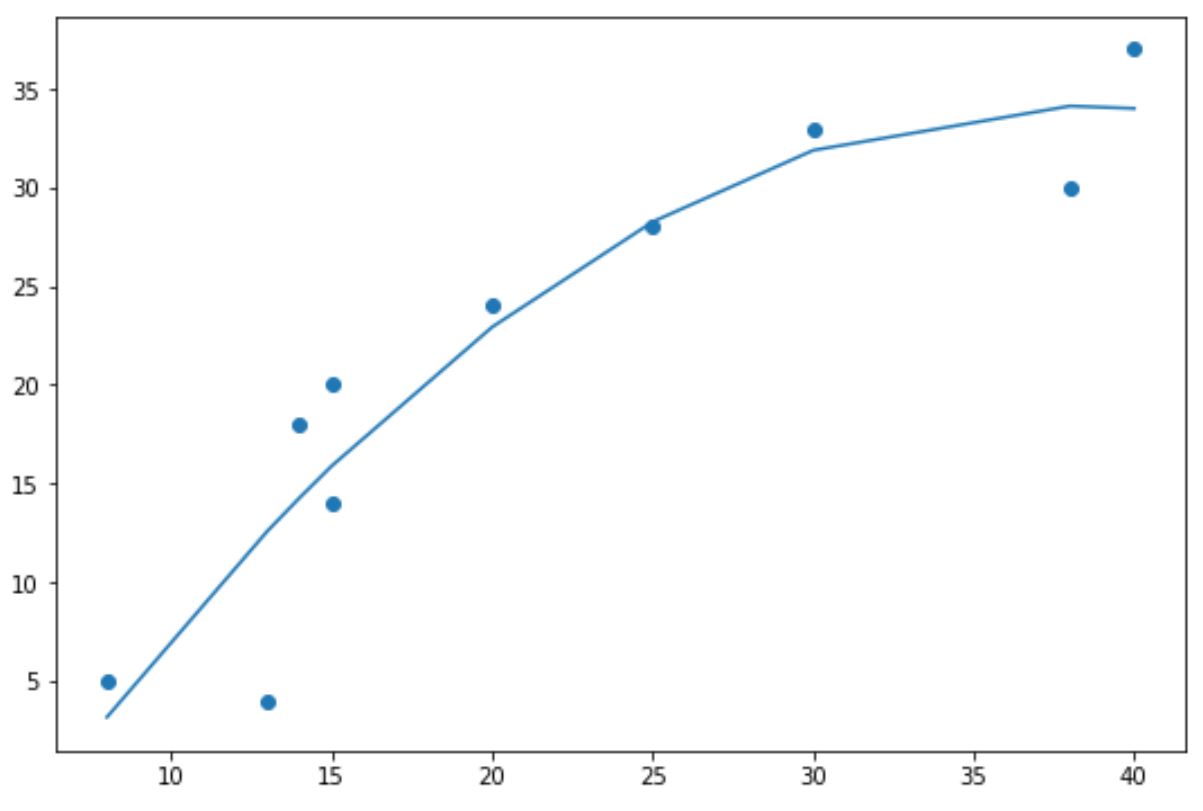
Notice that the trendline is now curved instead of straight.
This polynomial trendline is particularly useful when your data exhibits a non-linear pattern and a straight line doesn’t do a good job of capturing the trend in the data.
Additional Resources
The following tutorials explain how to perform other common functions in Matplotlib:
How to Hide Axes in Matplotlib
How to Rotate Tick Labels in Matplotlib
How to Change the Number of Ticks in Matplotlib