You can use one of the following methods to adjust the position of a title in a Matplotlib plot:
#adjust title position using 'loc' argument (left, center, right)
plt.title('My Title', loc='right')

#adjust title position using x and y coordinates
plt.title('My Title', x=0.5, y=1.1)
The following examples show how to use each of these methods in practice.
Method 1: Adjust Title Position Using ‘loc’
The following code shows how to adjust the position of a title in Matplotlib using the loc argument.
import matplotlib.pyplot as plt

#define x and y
x = [1, 4, 10]
y = [5, 9, 27]

#create plot of x and y
plt.plot(x, y)

#add title
plt.title('My Title', loc='left')
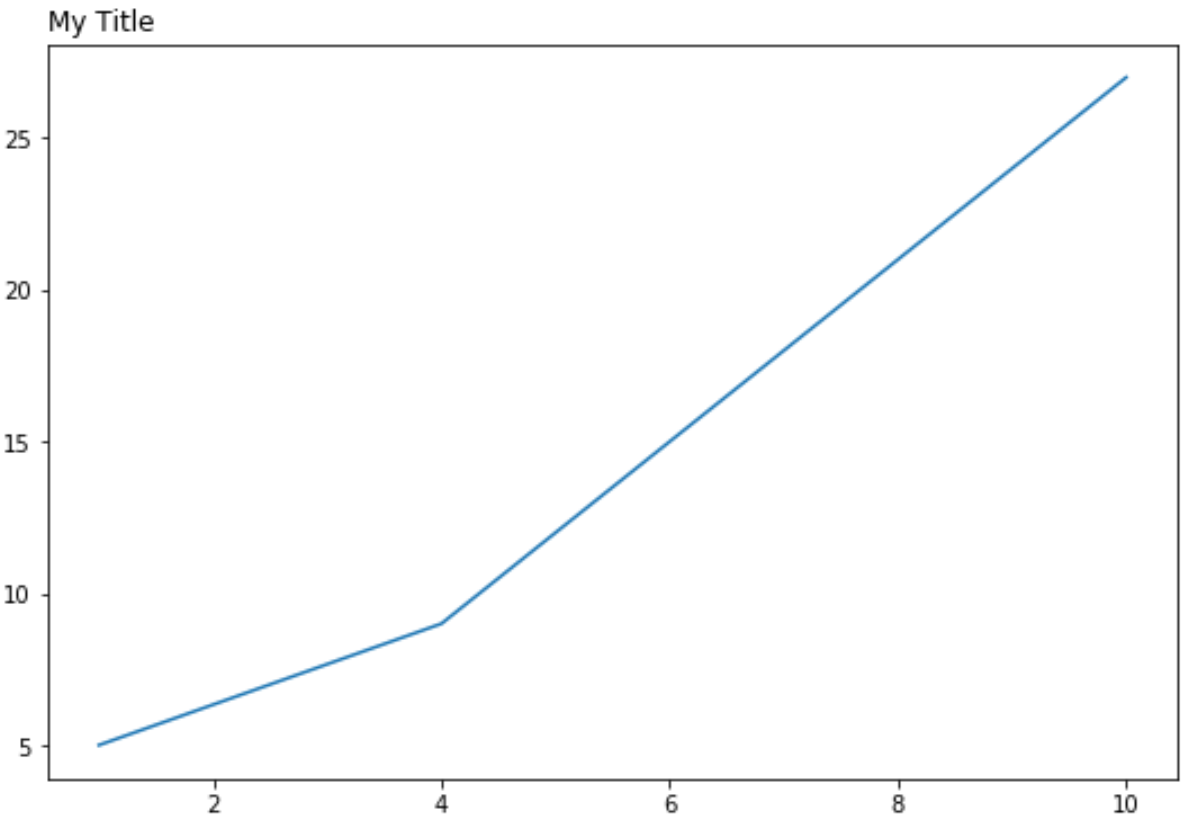
Note: You can use the loc argument to specify one of three positions: left, center, or right. The default position is center.
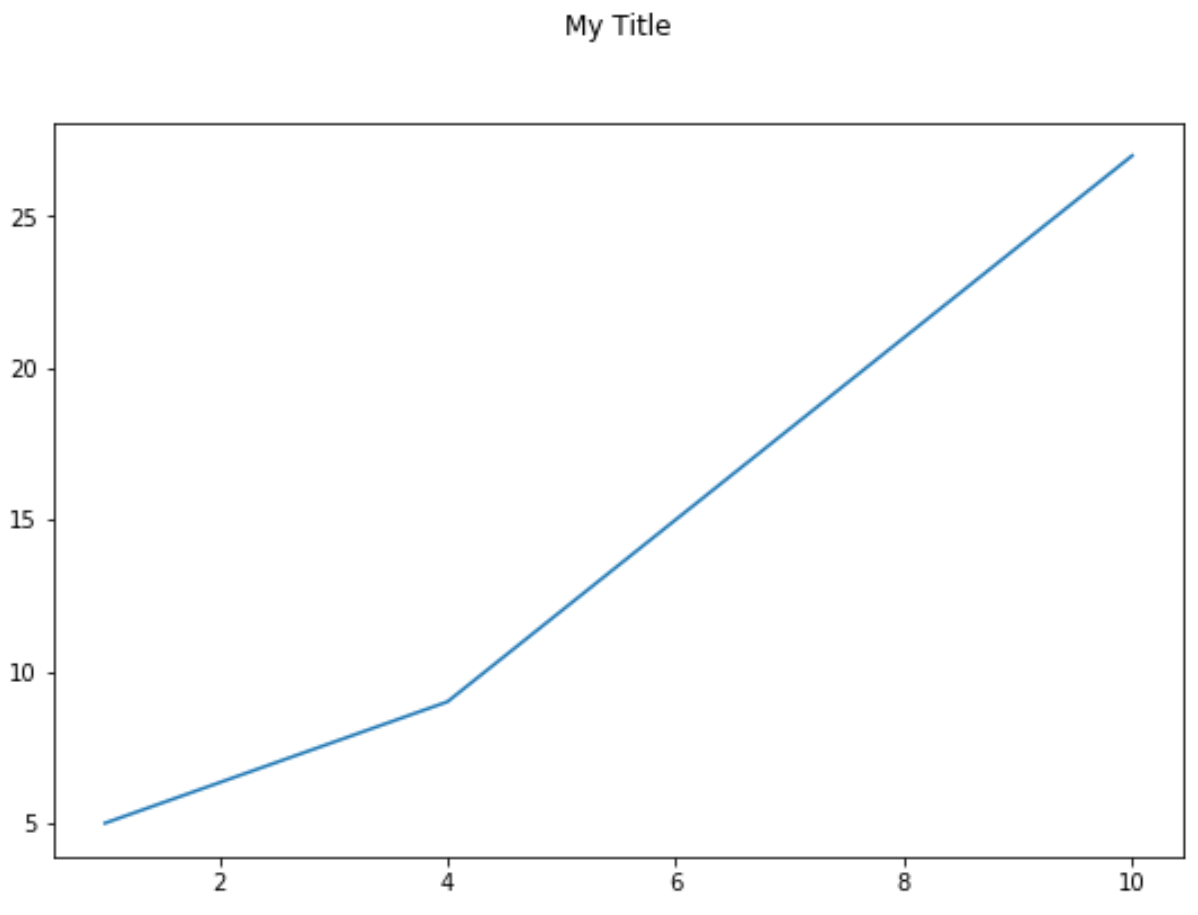
Method 2: Adjust Title Position Using (x, y) Coordinates
The following code shows how to adjust the position of a title in Matplotlib using x and y coordinates.
import matplotlib.pyplot as plt

#define x and y
x = [1, 4, 10]
y = [5, 9, 27]

#create plot of x and y
plt.plot(x, y)

#add title
plt.title('My Title', x=0.5, y=1.1)
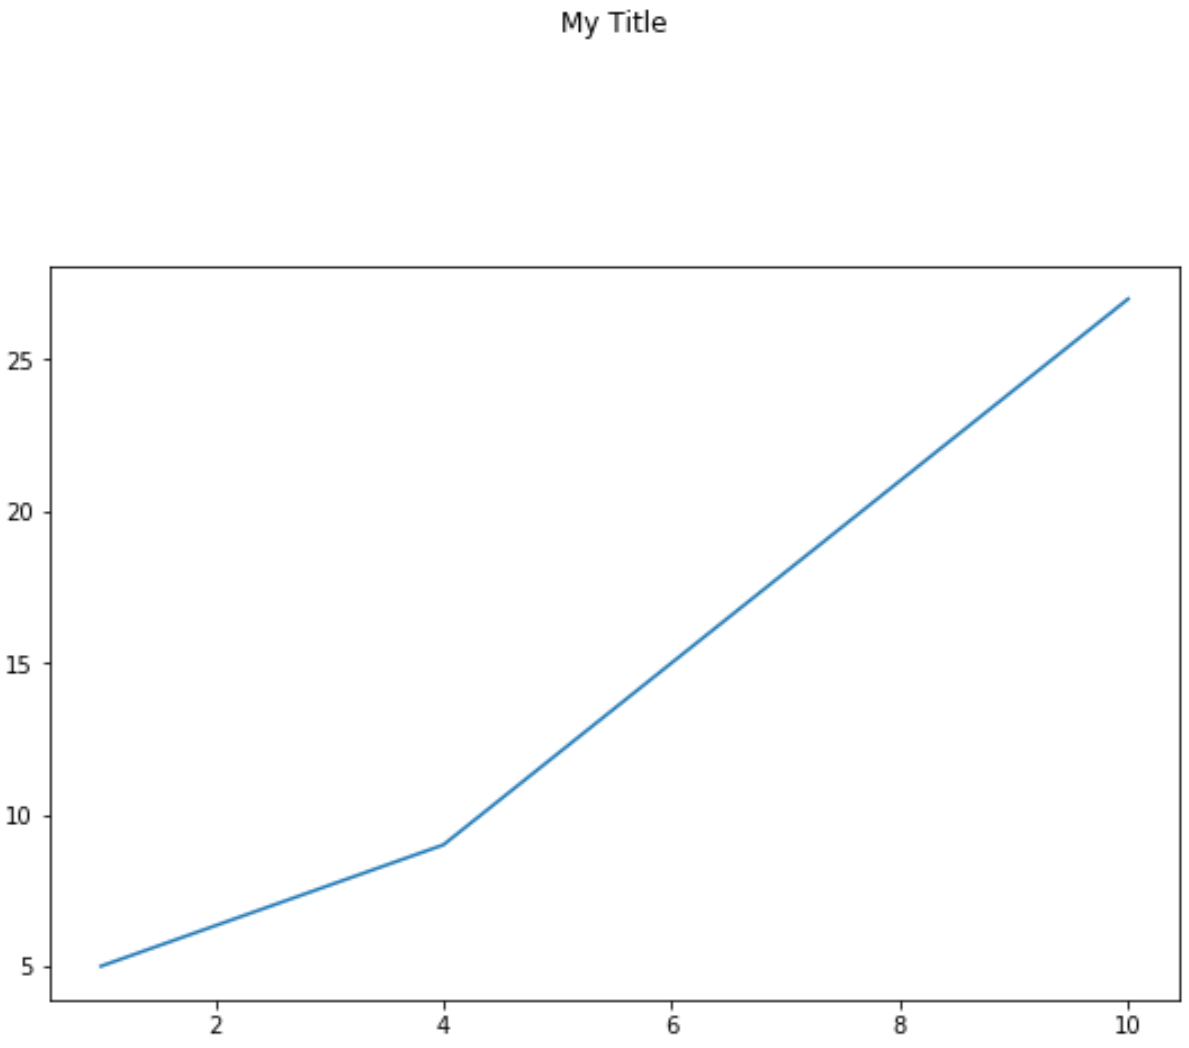
You can also choose to just specify one of the coordinates. For example, you can specify only the y-coordinate:
import matplotlib.pyplot as plt

#define x and y
x = [1, 4, 10]
y = [5, 9, 27]

#create plot of x and y
plt.plot(x, y)

#add title
plt.title('My Title', y=1.3)
Additional Resources
How to Increase Plot Size in Matplotlib
How to Set Axis Ranges in Matplotlib
How to Set X-Axis Values in Matplotlib
How to Change the Number of Ticks in Matplotlib