You can use the following syntax to plot a time series in Matplotlib:
import matplotlib.pyplot as plt

plt.plot(df.x, df.y)
This makes the assumption that the x variable is of the class datetime.datetime().
The following examples show how to use this syntax to plot time series data in Python.
Example 1: Plot a Basic Time Series in Matplotlib
The following code shows how to plot a time series in Matplotlib that shows the total sales made by a company during 12 consecutive days:
import matplotlib.pyplot as plt
import datetime
import numpy as np
import pandas as pd

#define data
df = pd.DataFrame({'date': np.array([datetime.datetime(2020, 1, i+1)
                                     for i in range(12)]),
                   'sales': [3, 4, 4, 7, 8, 9, 14, 17, 12, 8, 8, 13]})

#plot time series
plt.plot(df.date, df.sales, linewidth=3)
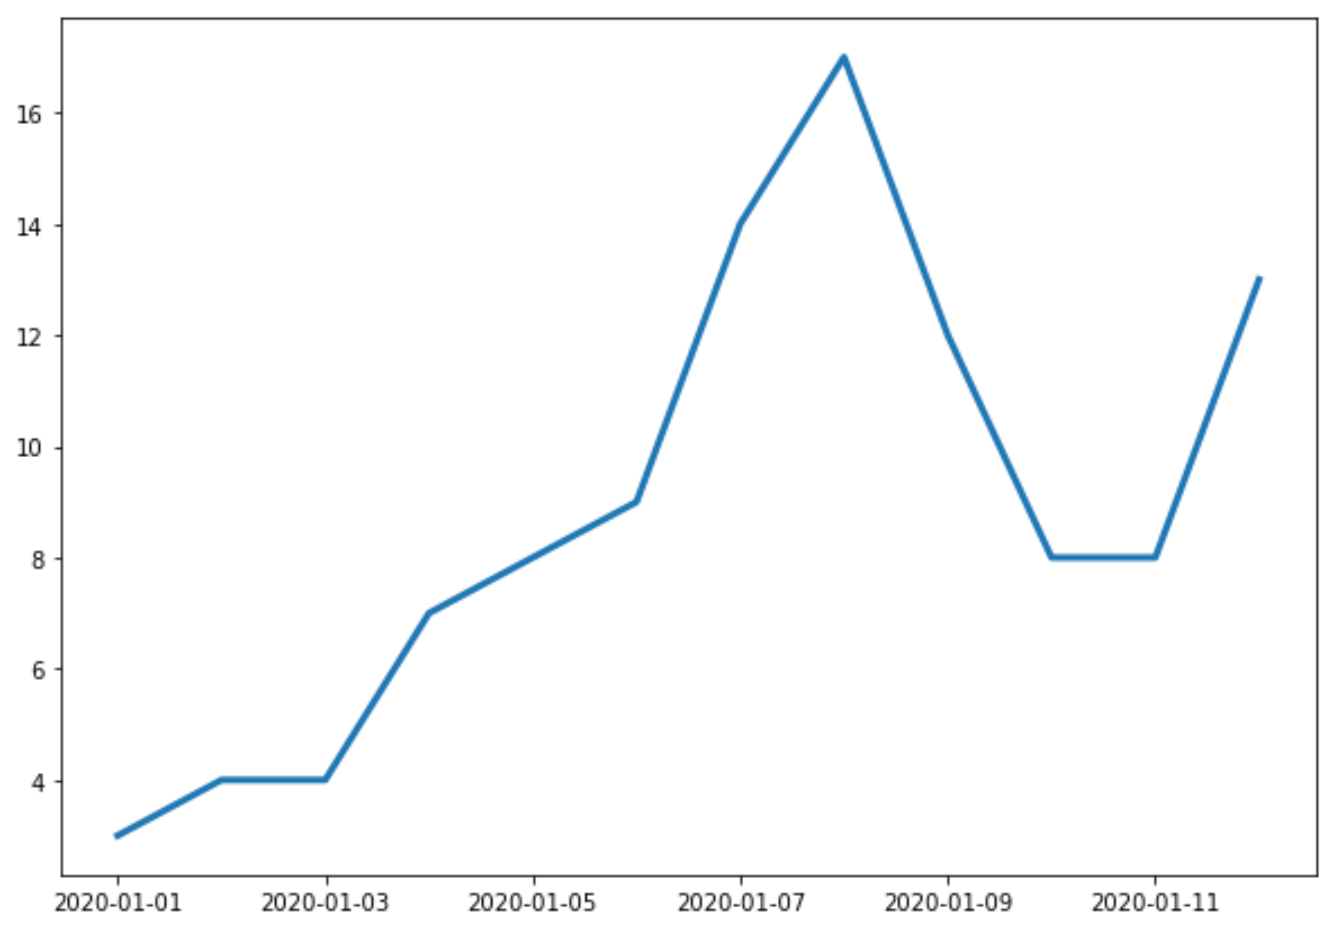
The x-axis shows the date and the y-axis shows the total sales on each date.
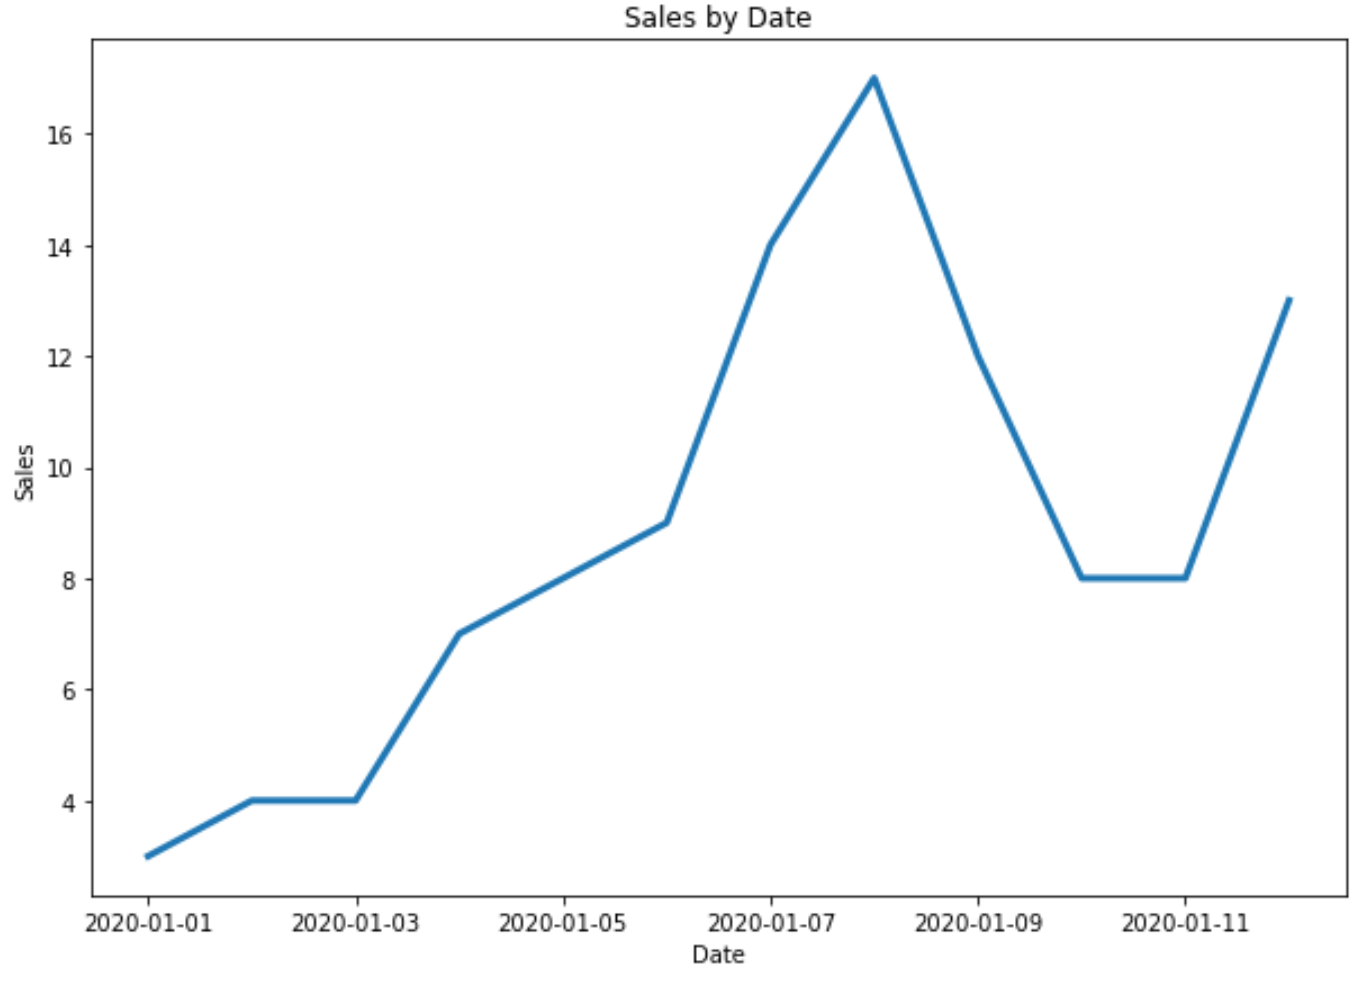
Example 2: Customize the Title & Axis Labels
You can use the following code to add a title and axis labels to the plot:
import matplotlib.pyplot as plt
import datetime
import numpy as np
import pandas as pd

#define data
df = pd.DataFrame({'date': np.array([datetime.datetime(2020, 1, i+1)
                                     for i in range(12)]),
                   'sales': [3, 4, 4, 7, 8, 9, 14, 17, 12, 8, 8, 13]})

#plot time series
plt.plot(df.date, df.sales, linewidth=3)

#add title and axis labels
plt.title('Sales by Date')
plt.xlabel('Date')
plt.ylabel('Sales')
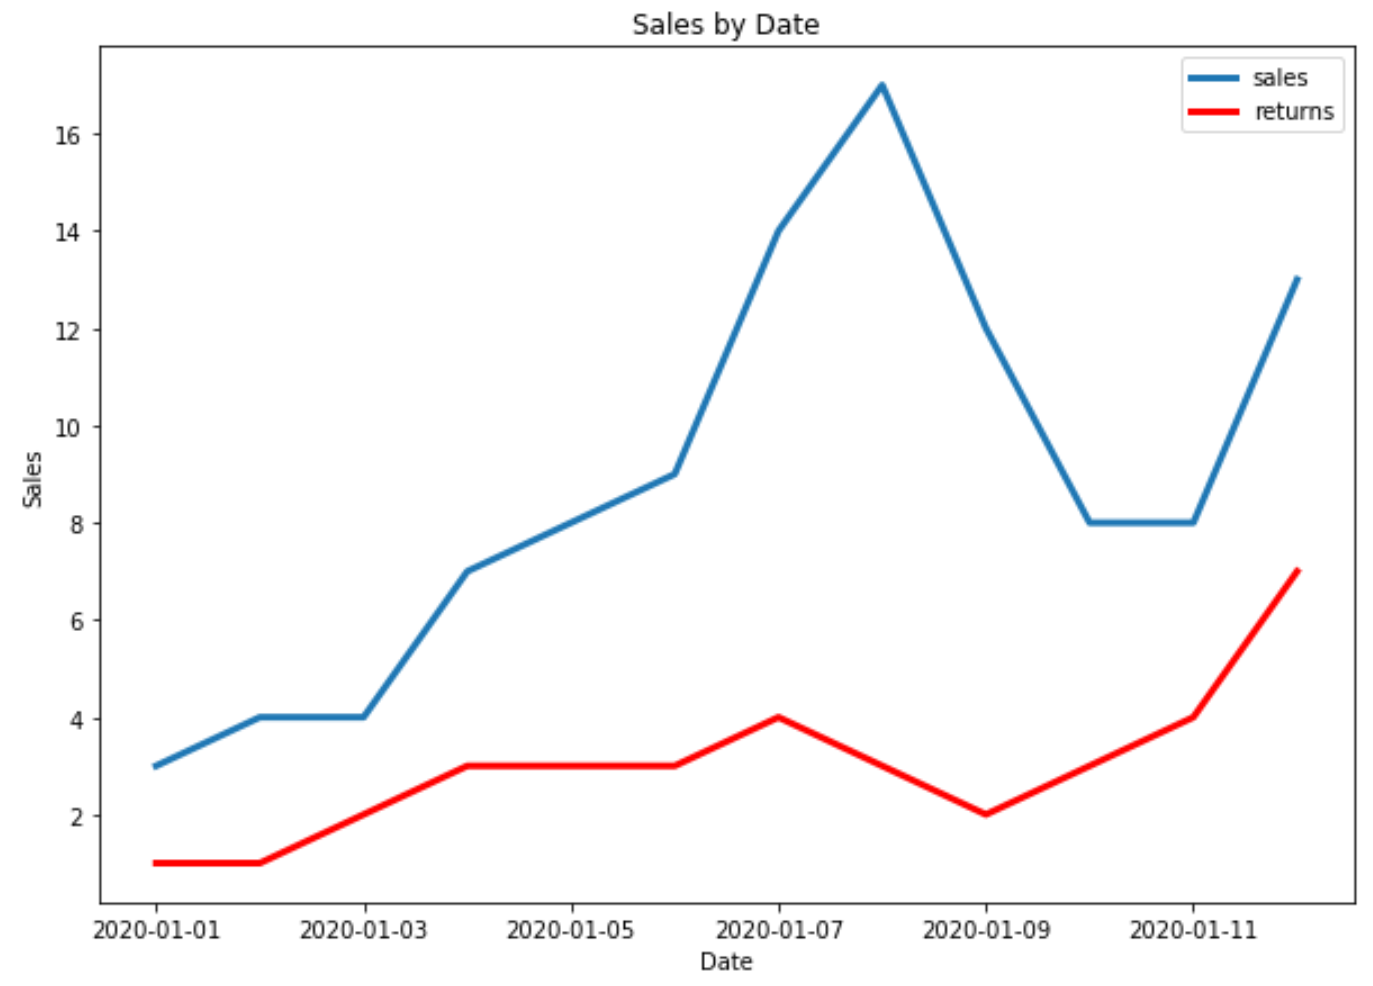
Example 3: Plot Multiple Time Series in Matplotlib
The following code shows how to plot multiple time series in one plot in Matplotlib:
import matplotlib.pyplot as plt
import datetime
import numpy as np
import pandas as pd

#define data
df = pd.DataFrame({'date': np.array([datetime.datetime(2020, 1, i+1)
                                     for i in range(12)]),
                   'sales': [3, 4, 4, 7, 8, 9, 14, 17, 12, 8, 8, 13]})

df2 = pd.DataFrame({'date': np.array([datetime.datetime(2020, 1, i+1)
                                      for i in range(12)]),
                   'returns': [1, 1, 2, 3, 3, 3, 4, 3, 2, 3, 4, 7]})

#plot both time series
plt.plot(df.date, df.sales, label='sales', linewidth=3)
plt.plot(df2.date, df2.returns, color='red', label='returns', linewidth=3)

#add title and axis labels
plt.title('Sales by Date')
plt.xlabel('Date')
plt.ylabel('Sales')

#add legend
plt.legend()

#display plot
plt.show()
Additional Resources
Matplotlib: How to Create Boxplots by Group
Matplotlib: How to Create Stacked Bar Charts