You can use the following syntax to set the tick labels font size of plots in Matplotlib:
import matplotlib.pyplot as plt

#set tick labels font size for both axes
plt.tick_params(axis='both', which='major', labelsize=20)

#set tick labels font size for x-axis only
plt.tick_params(axis='x', which='major', labelsize=20)

#set tick labels font size for y-axis only
plt.tick_params(axis='y', which='major', labelsize=20)
The following examples show how to use this syntax in practice.
Example 1: Set Tick Labels Font Size for Both Axes
The following code shows how to create a plot using Matplotlib and specify the tick labels font size for both axes:
import matplotlib.pyplot as plt

#define x and y
x = [1, 4, 10]
y = [5, 11, 27]

#create plot of x and y
plt.plot(x, y)

#set tick labels font size for both axes
plt.tick_params(axis='both', which='major', labelsize=20)

#display plot
plt.show()
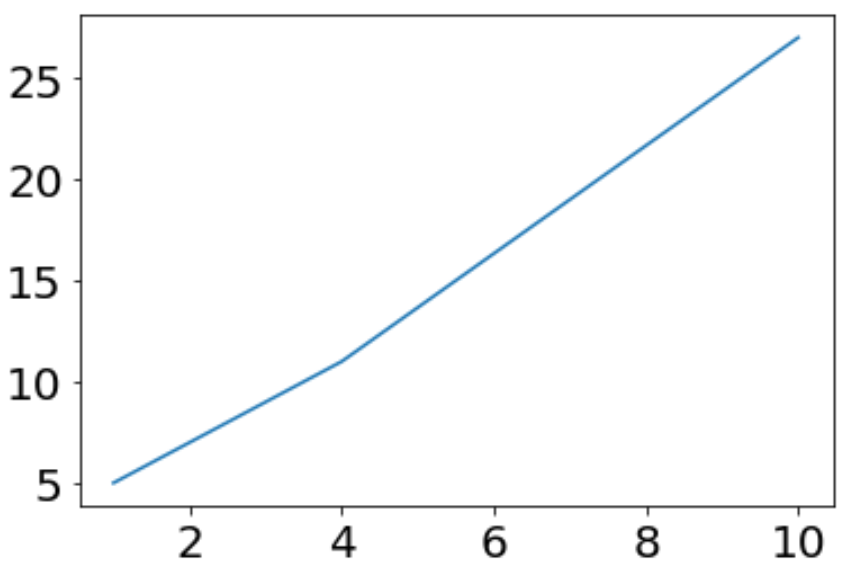
Notice that we increased both the x-axis and y-axis tick labels font size.
Example 2: Set Tick Labels Font Size for X-Axis Only
The following code shows how to create a plot using Matplotlib and specify the tick labels font size for just the x-axis:
import matplotlib.pyplot as plt

#define x and y
x = [1, 4, 10]
y = [5, 11, 27]

#create plot of x and y
plt.plot(x, y)

#set tick labels font size for both axes
plt.tick_params(axis='x', which='major', labelsize=20)

#display plot
plt.show()
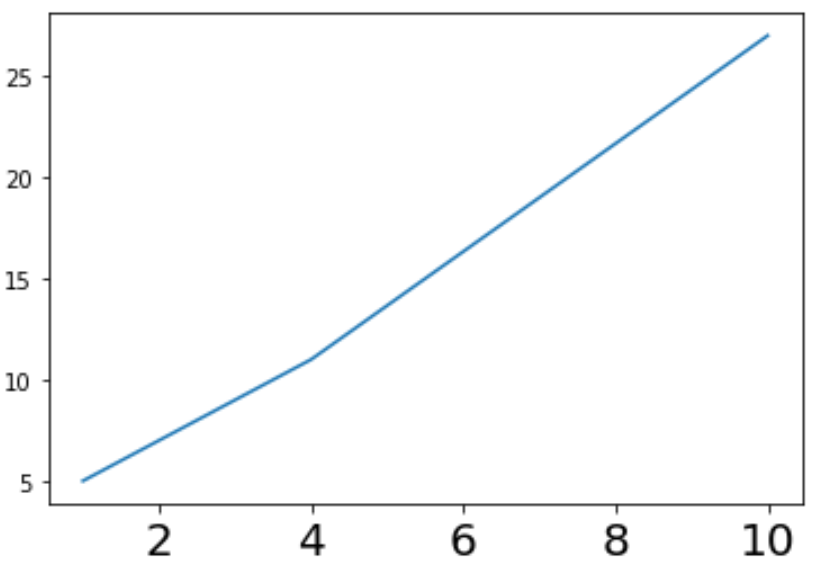
Notice that we increased just the x-axis tick labels font size.
Example 3: Set Tick Labels Font Size for Y-Axis Only
The following code shows how to create a plot using Matplotlib and specify the tick labels font size for just the y-axis:
import matplotlib.pyplot as plt

#define x and y
x = [1, 4, 10]
y = [5, 11, 27]

#create plot of x and y
plt.plot(x, y)

#set tick labels font size for both axes
plt.tick_params(axis='y', which='major', labelsize=20)

#display plot
plt.show()
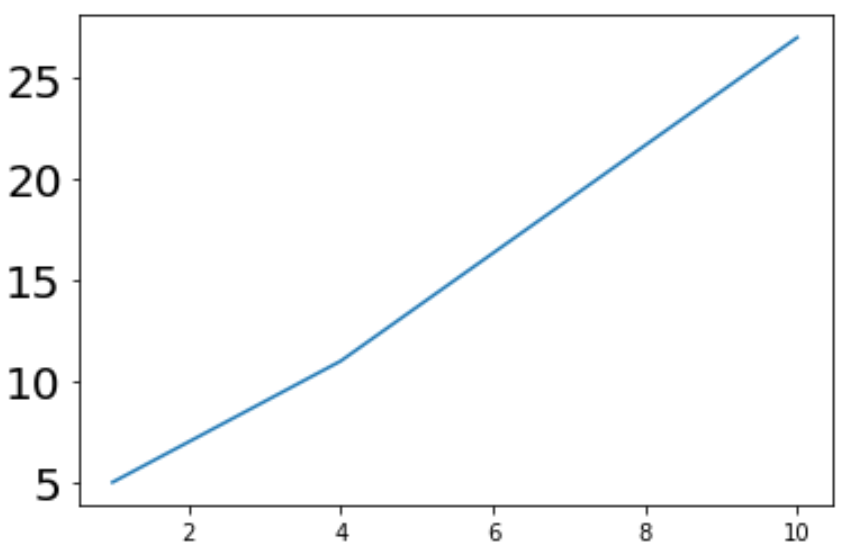
Notice that we increased just the y-axis tick labels font size.
Additional Resources
How to Create Multiple Matplotlib Plots in One Figure
How to Increase Plot Size in Matplotlib
How to Change Legend Font Size in Matplotlib
How to Add Text to Matplotlib Plots