Often you may want to remove ticks from one or more axes in a Matplotlib plot. Fortunately this is easy to do using the tick_params() function.
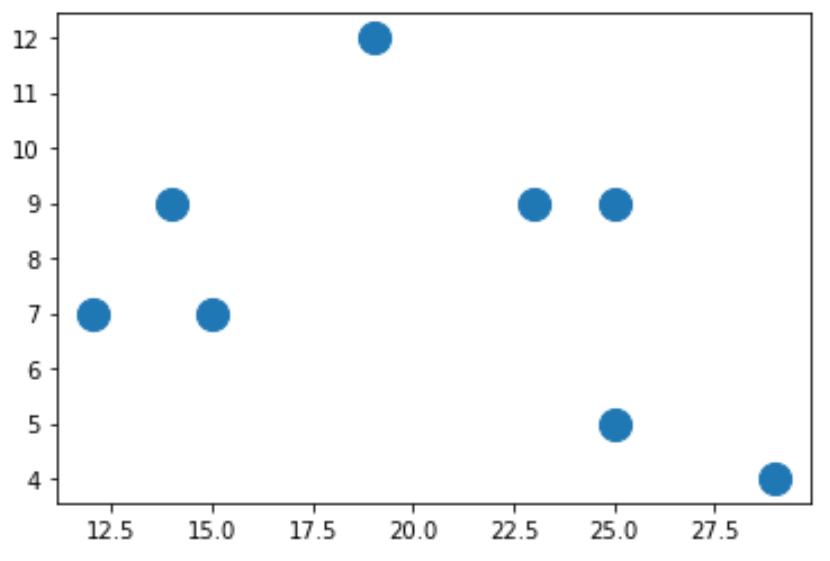
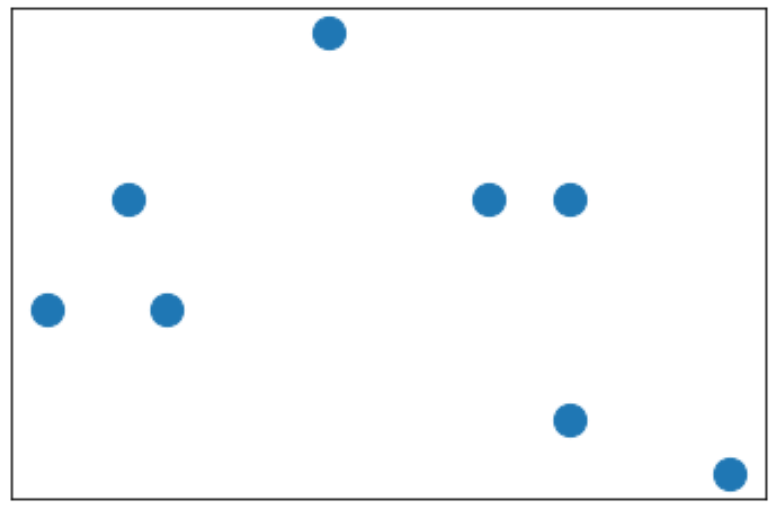
This tutorial shows several examples of how to use this function in practice based on the following scatterplot:
import matplotlib.pyplot as plt

#create data
x = [25, 12, 15, 14, 19, 23, 25, 29]
y = [5, 7, 7, 9, 12, 9, 9, 4]

#create scatterplot
plt.scatter(x, y, s=200)
Example 1: Remove Ticks From a Single Axis
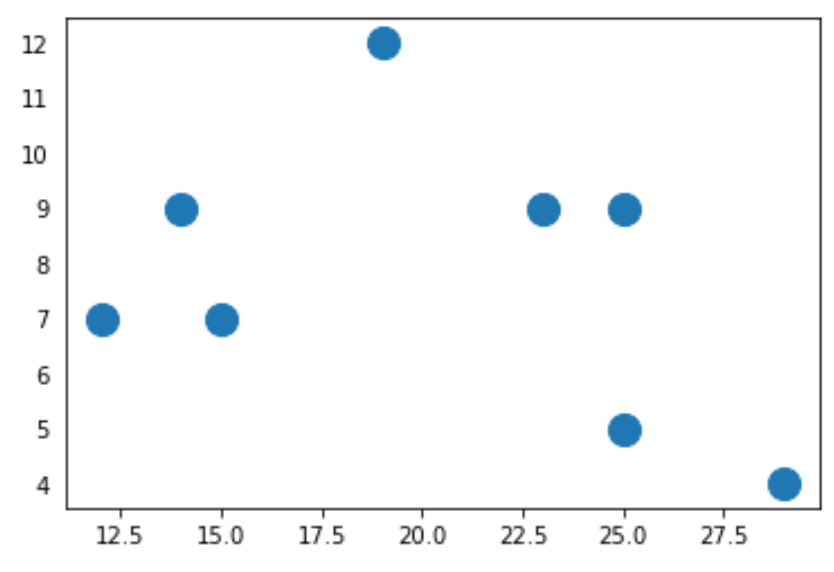
The following code shows how to remove the ticks from the y-axis:
plt.tick_params(left=False)

plt.scatter(x, y, s=200)
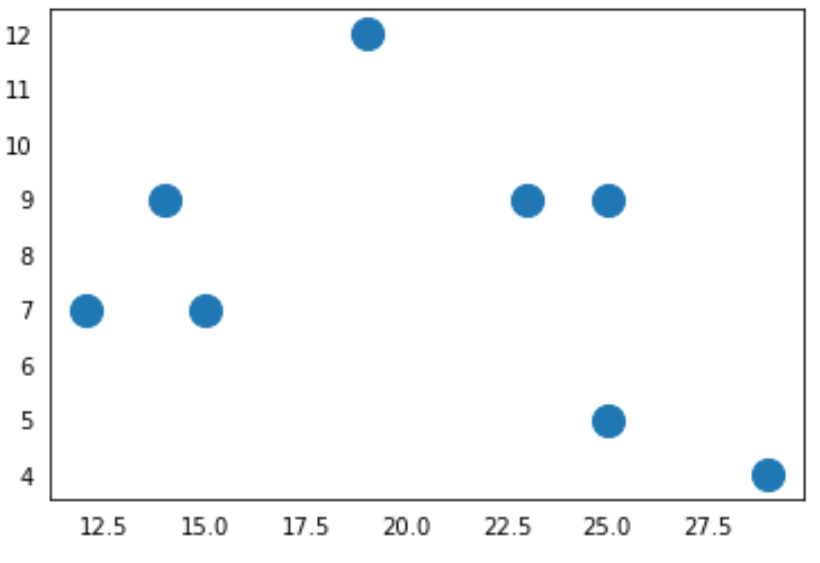
And the following code shows how to remove the ticks from the x-axis:
plt.tick_params(bottom=False)

plt.scatter(x, y, s=200)
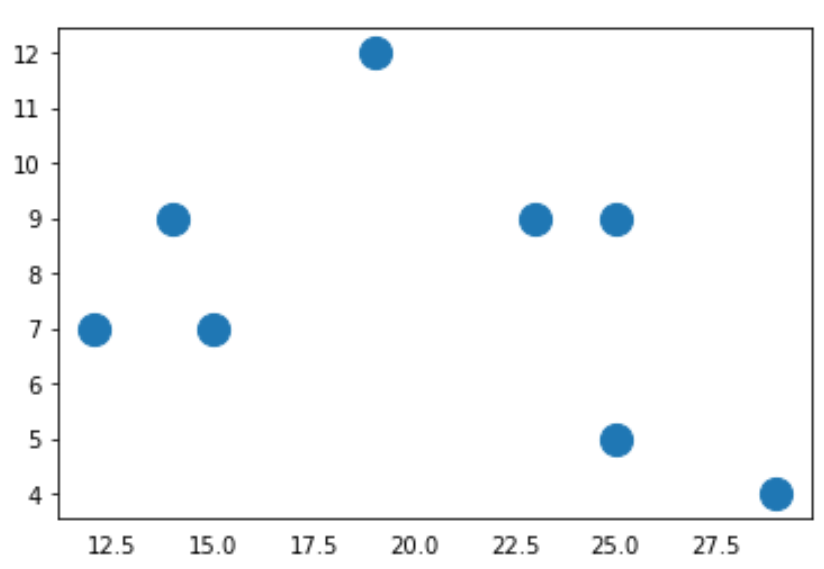
Example 2: Remove Ticks from Both Axes
The following code shows how to remove the ticks from both axes:
plt.tick_params(left=False,
                bottom=False)

plt.scatter(x, y, s=200)
Example 3: Remove Ticks and Labels from Axes
The following code shows how to remove the ticks and the labels from both axes:
plt.tick_params(left=False,
                bottom=False,
                labelleft=False,
                labelbottom=False)

plt.scatter(x, y, s=200)
You can find more Matplotlib tutorials here.