You can use the following syntax to change the number of ticks on each axis in Matplotlib:
#specify number of ticks on x-axis
plt.locator_params(axis='x', nbins=4)

#specify number of ticks on y-axis
plt.locator_params(axis='y', nbins=2)
The nbins argument specifies how many ticks to display on each axis.
The following examples show how to use this syntax in practice.
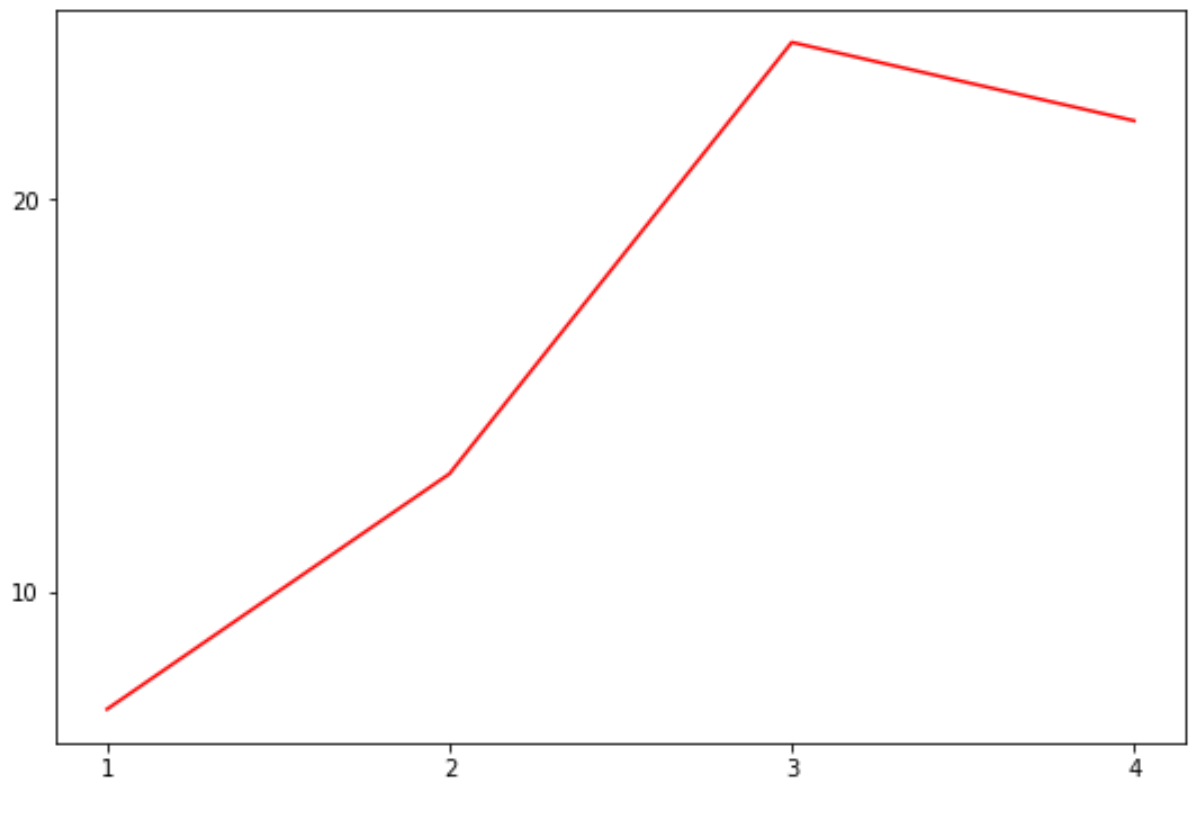
Example 1: Specify Number of Ticks on Both Axes
The following code shows how to specify the number of ticks on both axes in a plot:
import matplotlib.pyplot as plt

#define data
x = [1, 2, 3, 4]
y = [7, 13, 24, 22]

#create plot
plt.plot(x, y, color='red')

#specify number of ticks on axes
plt.locator_params(axis='x', nbins=4)
plt.locator_params(axis='y', nbins=2)
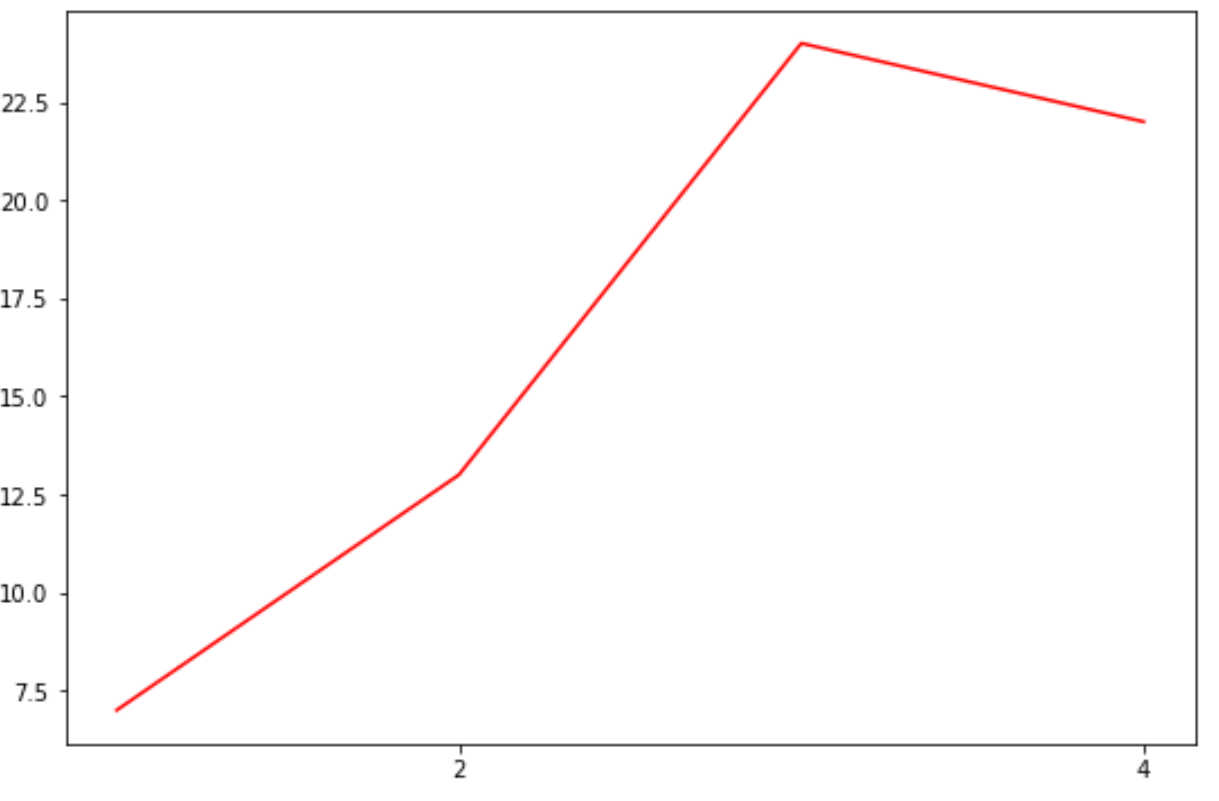
Example 2: Specify Number of Ticks on X-Axis Only
The following code shows how to specify the number of ticks just on the x-axis:
import matplotlib.pyplot as plt

#define data
x = [1, 2, 3, 4]
y = [7, 13, 24, 22]

#create plot
plt.plot(x, y, color='red')

#specify number of ticks on x-axis
plt.locator_params(axis='x', nbins=2)
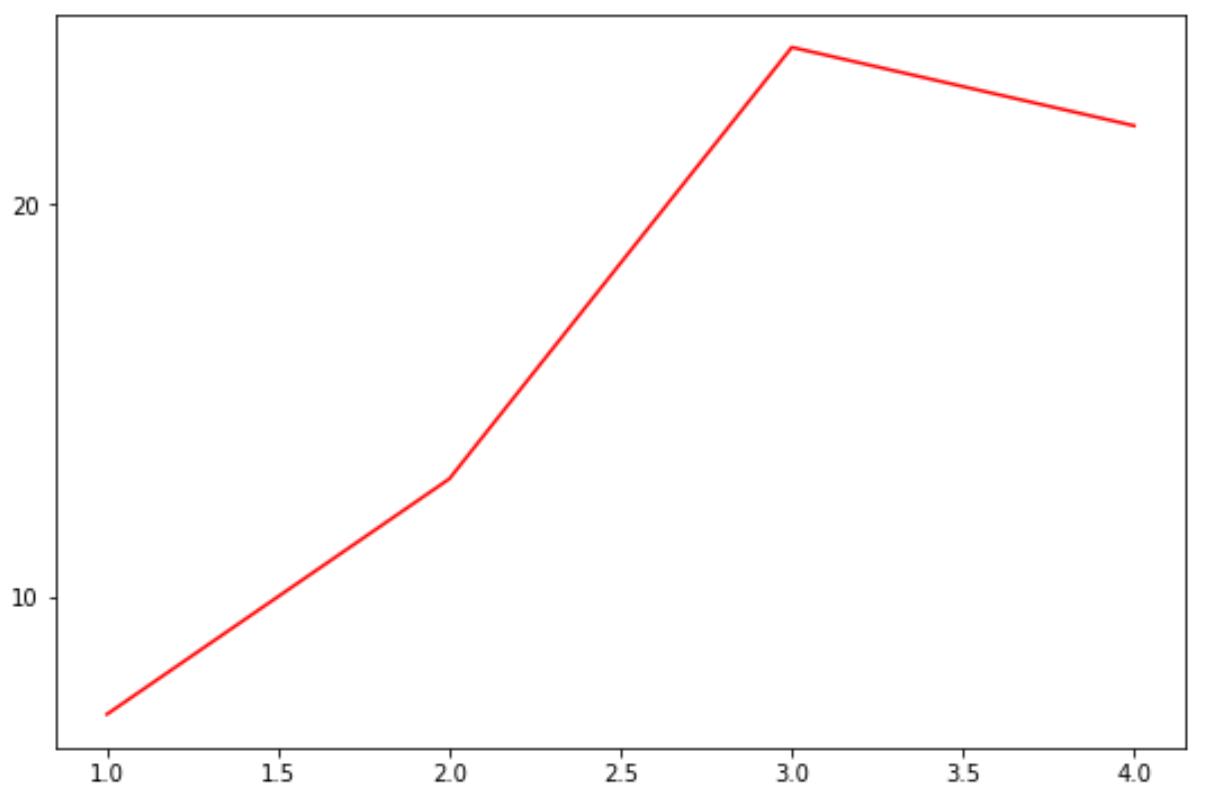
Example 3: Specify Number of Ticks on Y-Axis Only
The following code shows how to specify the number of ticks just on the y-axis:
import matplotlib.pyplot as plt

#define data
x = [1, 2, 3, 4]
y = [7, 13, 24, 22]

#create plot
plt.plot(x, y, color='red')

#specify number of ticks on y-axis
plt.locator_params(axis='y', nbins=2)
Additional Resources
How to Remove Ticks from Matplotlib Plots
How to Set Tick Labels Font Size in Matplotlib
How to Set X-Axis Values in Matplotlib
How to Set Axis Ranges in Matplotlib