You can use the s argument to adjust the marker size of points in Matplotlib:
plt.scatter(x, y, s=40)
The following examples show how to use this syntax in practice.
Example 1: Set a Single Marker Size for All Points
The following code shows how to create a scatterplot in Matplotlib and set a single marker size for all points in the plot:
import matplotlib.pyplot as plt

#define two arrays for plotting
A = [3, 5, 5, 6, 7, 8]
B = [12, 14, 17, 20, 22, 27]

#create scatterplot, specifying marker size to be 40
plt.scatter(A, B, s=40)
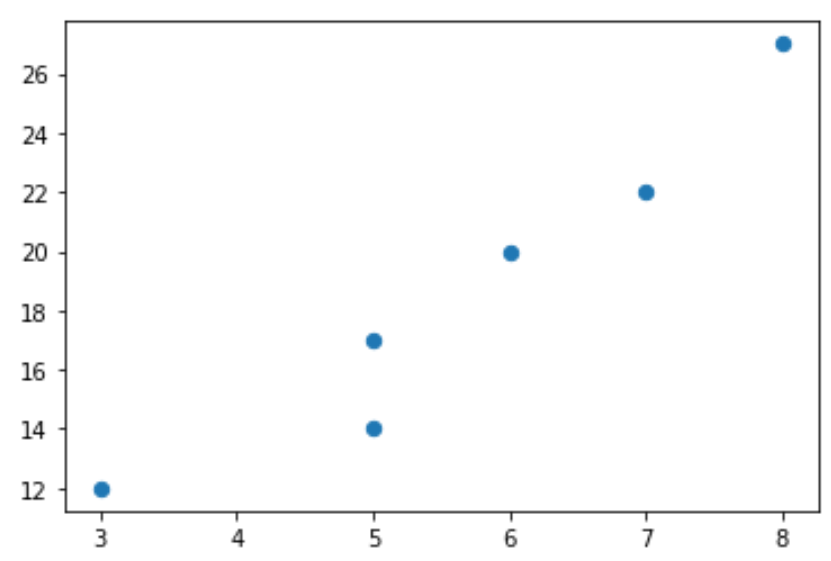
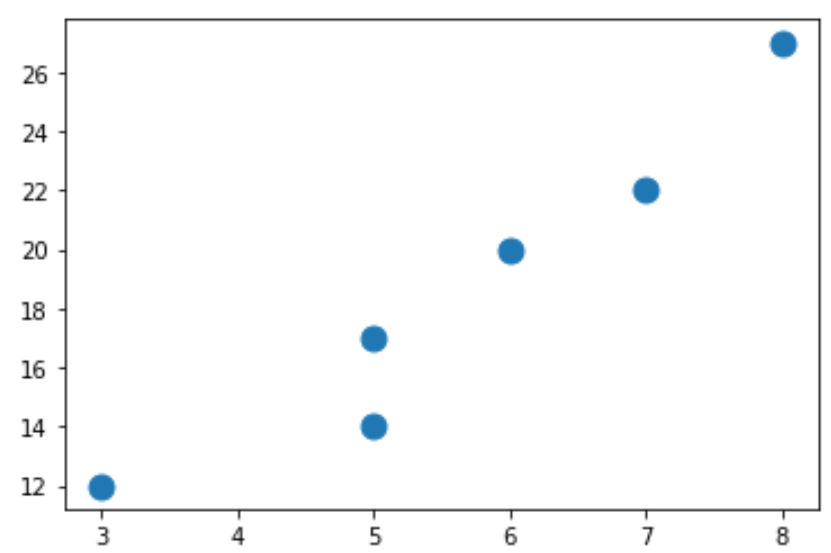
The larger the number we specify for the s argument, the larger the points will be in the plot:
import matplotlib.pyplot as plt

#define two arrays for plotting
A = [3, 5, 5, 6, 7, 8]
B = [12, 14, 17, 20, 22, 27]

#create scatterplot, specifying marker size to be 120
plt.scatter(A, B, s=120)
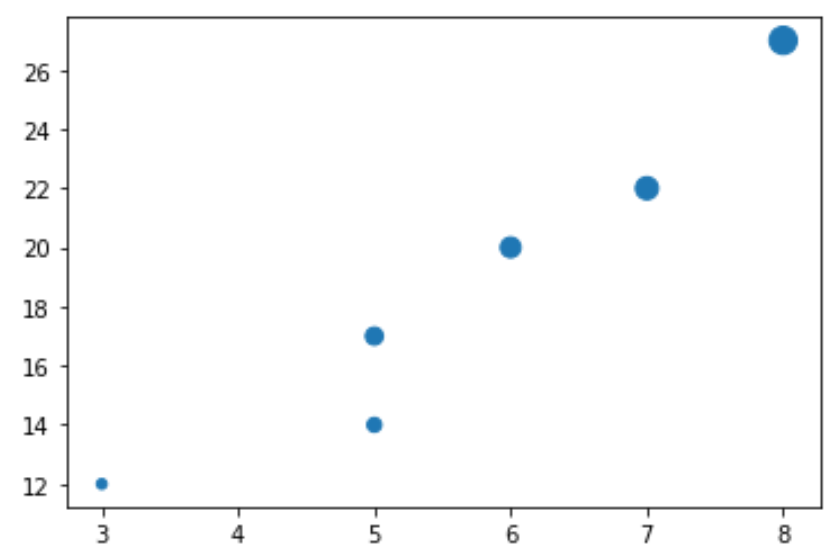
Example 2: Set Different Marker Sizes for Each Point
The following code shows how to create a scatterplot in Matplotlib and set a different marker size for each point in the plot:
import matplotlib.pyplot as plt

#define two arrays for plotting
A = [3, 5, 5, 6, 7, 8]
B = [12, 14, 17, 20, 22, 27]

#define array of marker sizes to use
sizes = [20, 40, 60, 80, 100, 150]

#create scatterplot, using marker sizes specified in array
plt.scatter(A, B, s=sizes)
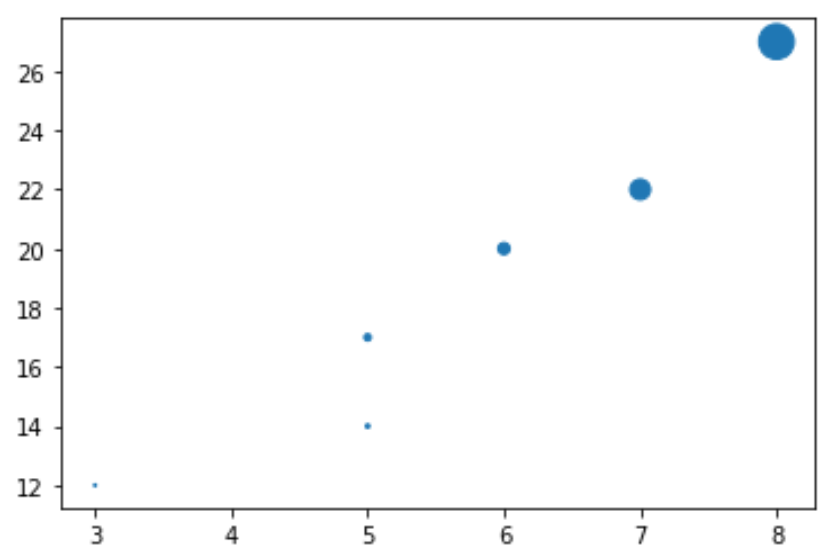
Example 3: Use a Function to Define Marker Sizes
The following code shows how to create a scatterplot in Matplotlib and use a function to define the marker sizes to use for each point in the plot:
import matplotlib.pyplot as plt

#define two arrays for plotting
A = [3, 5, 5, 6, 7, 8]
B = [12, 14, 17, 20, 22, 27]

#define array of marker sizes to use
sizes = [3**n for n in range(len(A))]

#create scatterplot, using marker sizes specified in function
plt.scatter(A, B, s=sizes)
You can find the complete Matplotlib documentation for adjusting marker size here.
Additional Resources
The following tutorials explain how to perform other common operations in Matplotlib:
How to Annotate Matplotlib Scatterplots
How to Add Legend to Scatterplot in Matplotlib