You can easily adjust the thickness of lines in Matplotlib plots by using the linewidth argument function, which uses the following syntax:
matplotlib.pyplot.plot(x, y, linewidth=1.5)
By default, the line width is 1.5 but you can adjust this to any value greater than 0.
This tutorial provides several examples of how to use this function in practice.
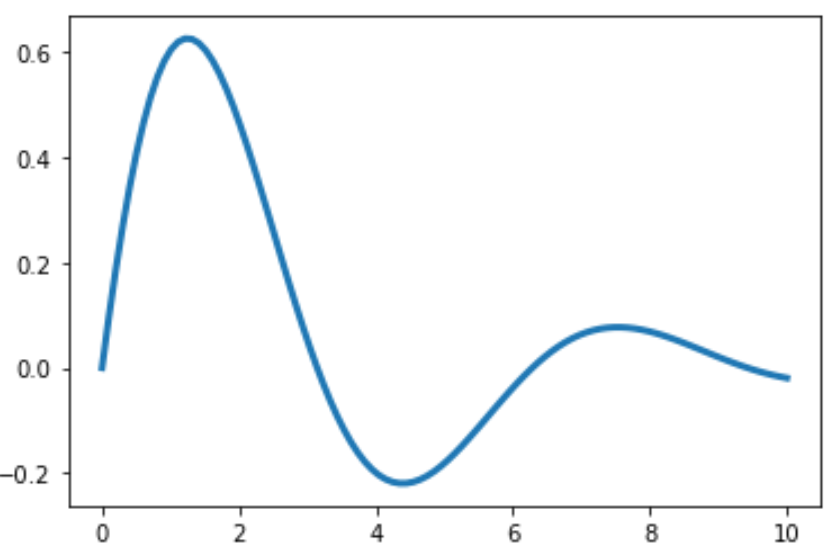
Example 1: Adjust the Thickness of One Line
The following code shows how to create a simple line chart and set the line width to 3:
import matplotlib.pyplot as plt
import numpy as np

#define x and y values
x = np.linspace(0, 10, 100)
y1 = np.sin(x)*np.exp(-x/3)

#create line plot with line width set to 3
plt.plot(x, y1, linewidth=3)

#display plot
plt.show()
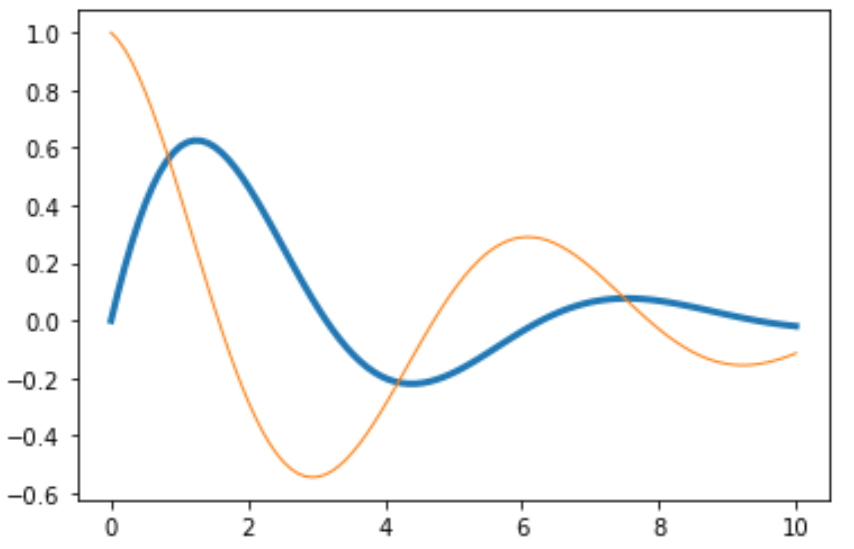
Example 2: Adjust the Thickness of Multiple Lines
The following code shows how to adjust the thickness of multiple lines at once:
import matplotlib.pyplot as plt
import numpy as np

#define x and y values
x = np.linspace(0, 10, 100)
y1 = np.sin(x)*np.exp(-x/3)
y2 = np.cos(x)*np.exp(-x/5)

#create line plot with multiple lines
plt.plot(x, y1, linewidth=3)
plt.plot(x, y2, linewidth=1)

#display plot
plt.show()
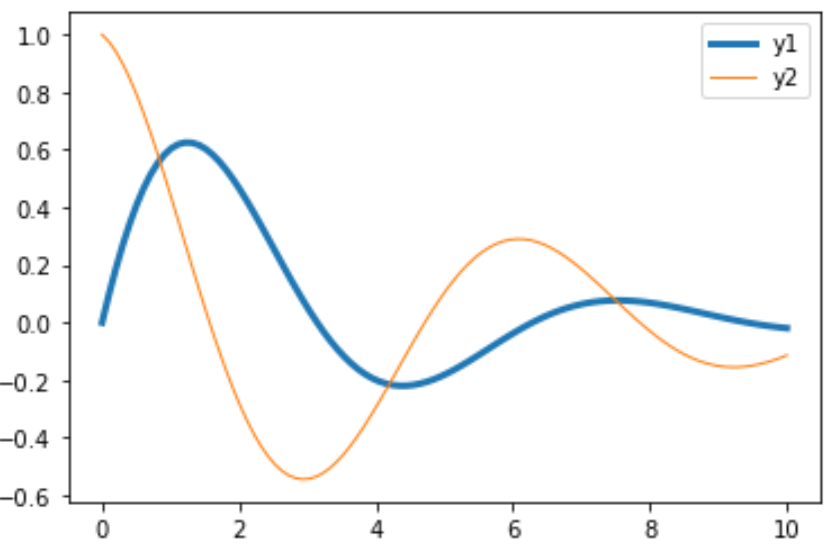
Example 3: Adjust Line Thickness in Legends
The following code shows how to create multiple lines with different thicknesses and create a legend that displays the the thickness of each line accordingly:
import matplotlib.pyplot as plt
import numpy as np

#define x and y values
x = np.linspace(0, 10, 100)
y1 = np.sin(x)*np.exp(-x/3)
y2 = np.cos(x)*np.exp(-x/5)

#create line plot with multiple lines
plt.plot(x, y1, linewidth=3, label='y1')
plt.plot(x, y2, linewidth=1, label='y2')

#add legend
plt.legend()

#display plot
plt.show()
Additional Resources
How to Fill in Areas Between Lines in Matplotlib
How to Remove Ticks from Matplotlib Plots
How to Place the Legend Outside of a Matplotlib Plot