By default, legends in Matplotlib plots do not include a title.
However, you can use the following basic syntax to add a title to a legend:
plt.legend(title='this is my title')
The following example shows how to use this syntax in practice.
Example 1: Add Title to Matplotlib Legend
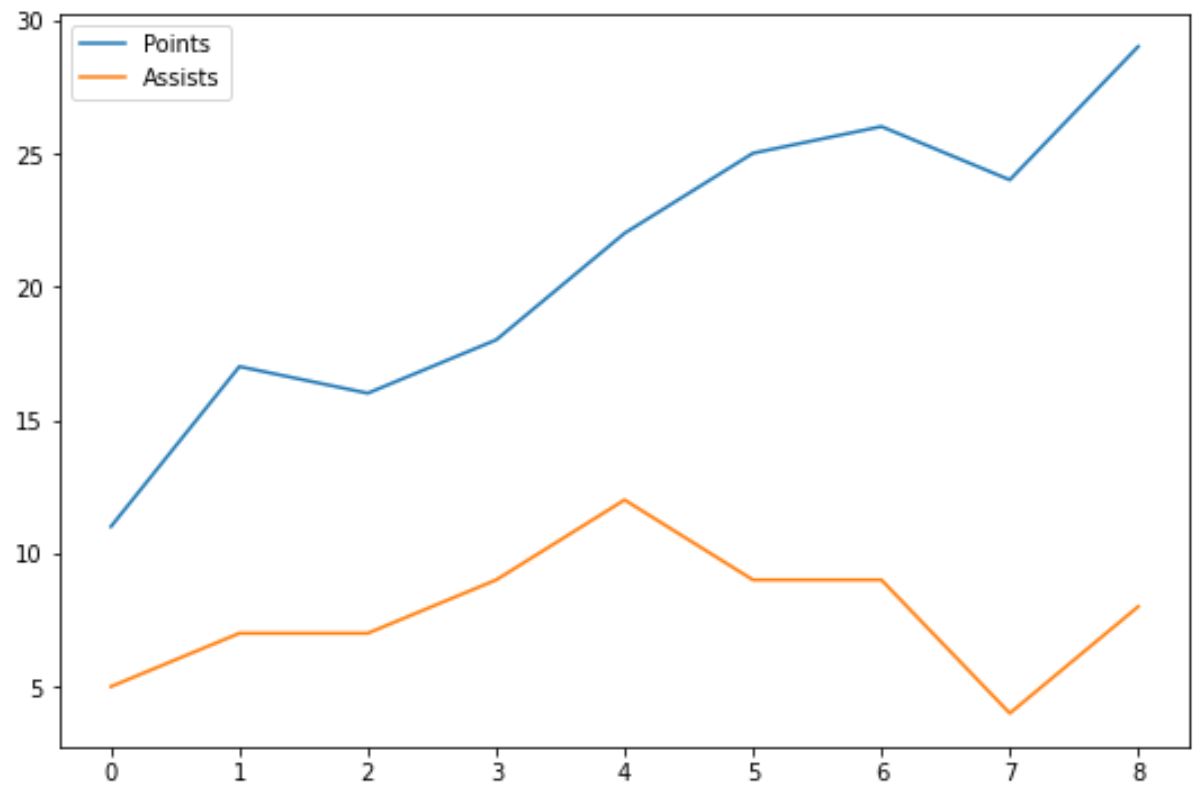
The following code shows how to create a Matplotlib plot with multiple lines and a legend:
import pandas as pd
import matplotlib.pyplot as plt

#create data
df = pd.DataFrame({'points': [11, 17, 16, 18, 22, 25, 26, 24, 29],
                   'assists': [5, 7, 7, 9, 12, 9, 9, 4, 8]})

#add lines to plot
plt.plot(df['points'], label='Points')
plt.plot(df['assists'], label='Assists')

#add legend
plt.legend()
Notice that the legend doesn’t have a title.
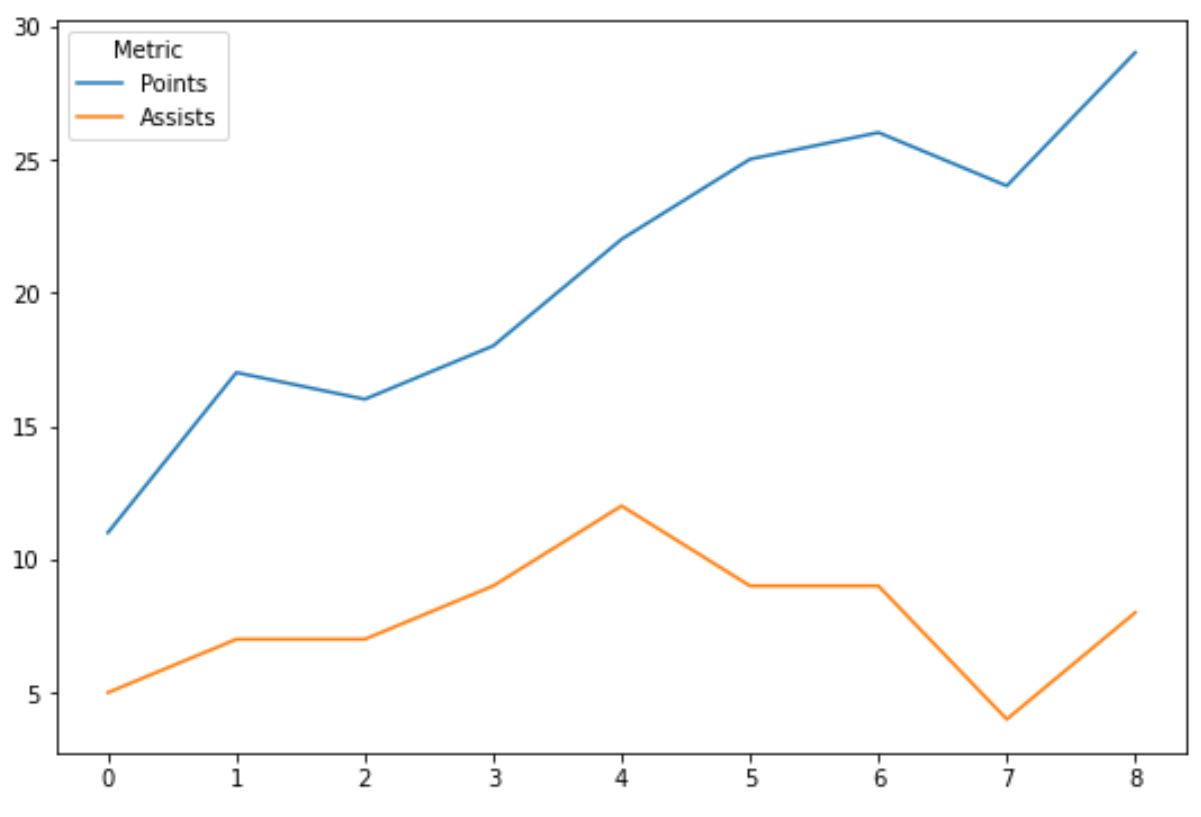
To add one, we can simply use the title argument within the plt.legend() function:
#add title to legend
plt.legend(title='Metric')
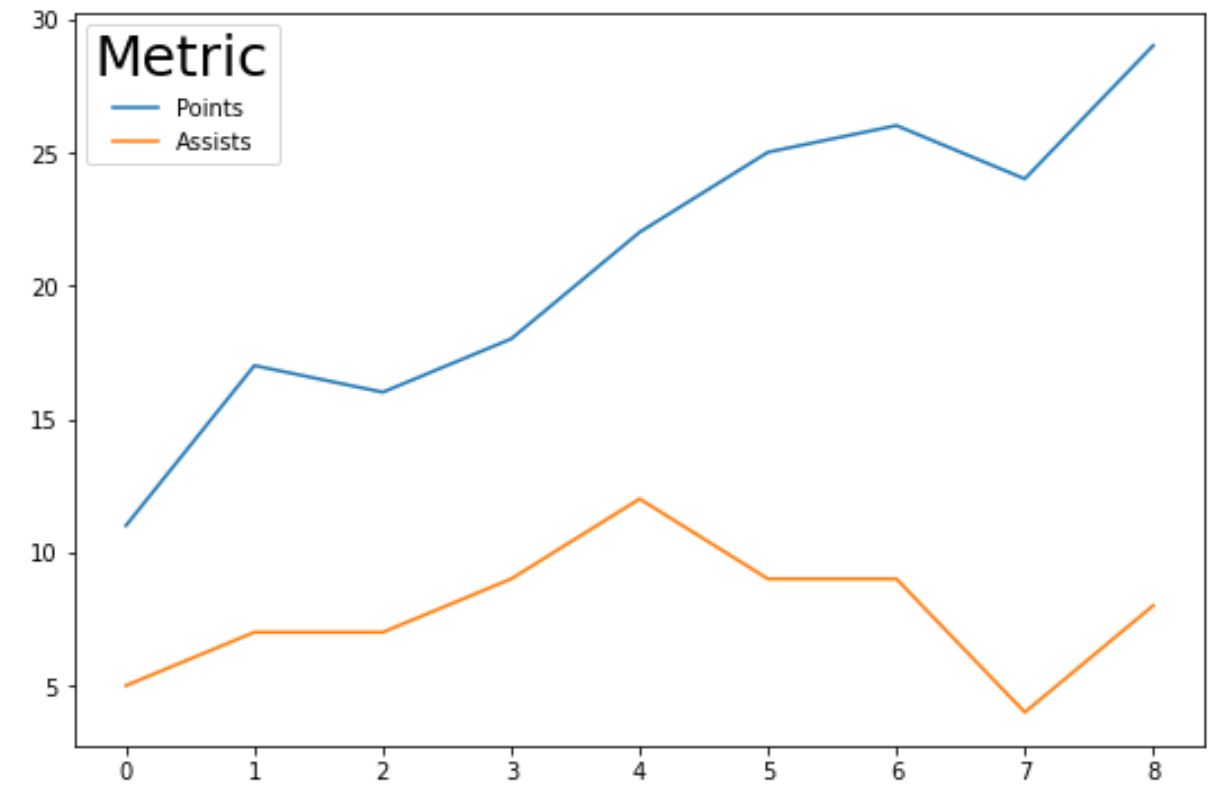
To modify the font size of the legend title, use the title_fontsize argument:
Note: The default font size is 10.
#add title to legend with increased font size
plt.legend(title='Metric', title_fontsize=25)
Notice that the font size of the legend is much larger now.
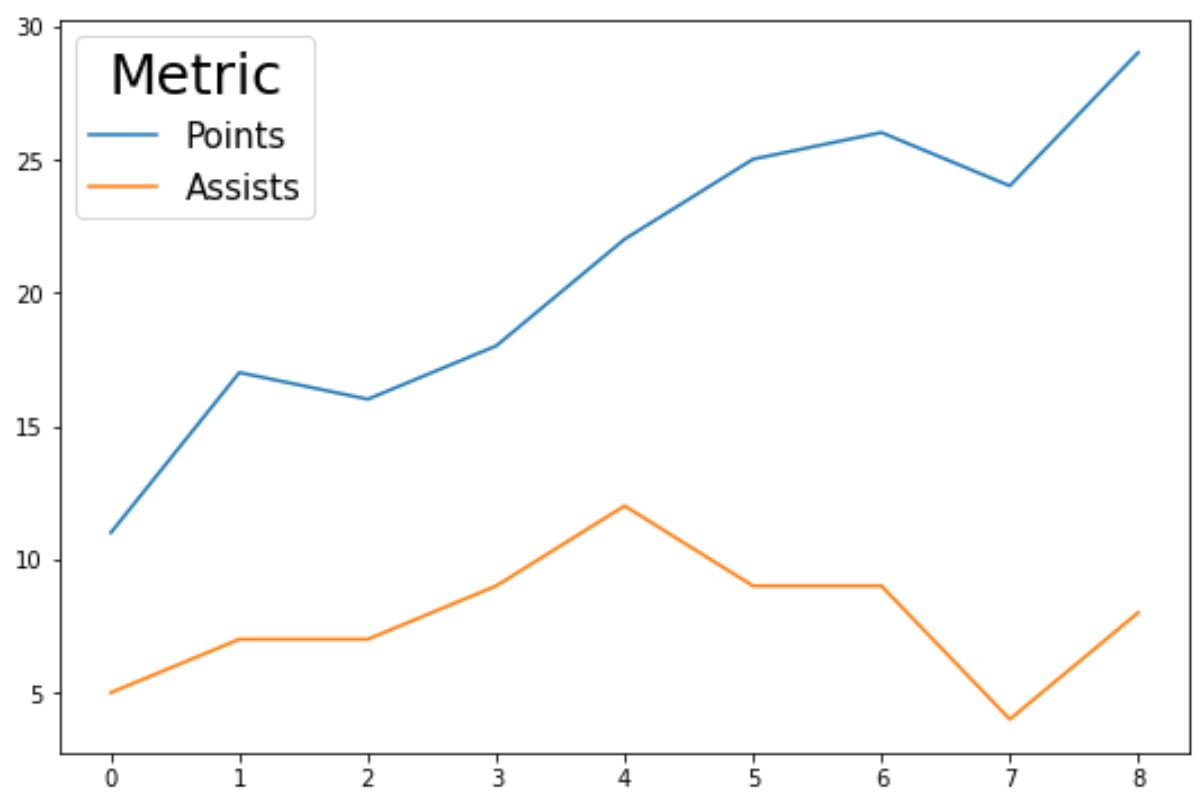
You can also use the fontsize argument to increase the font size of the labels in the legend:
#add title to legend with increased title and label font size
plt.legend(title='Metric', title_fontsize=25, fontsize=15)
Notice that the labels in the legend are much larger now.
Additional Resources
The following tutorials explain how to perform other common operations in Matplotlib:
How to Change Legend Font Size in Matplotlib
How to Change Order of Items in Matplotlib Legend
How to Change the Position of a Legend in Matplotlib


