You can use the following code to display and store Matplotlib plots within a Python Jupyter notebook:
%matplotlib inline
Here’s how this code is described within the documentation page:
“With this backend, the output of plotting commands is displayed inline within frontends like the Jupyter notebook, directly below the code cell that produced it. The resulting plots will then also be stored in the notebook document.”
The following example shows how to use this code in practice.
Example: How to Use %matplotlibe inline
Suppose we attempt to use the following code to create a Matplotlib line plot in a Jupyter notebook:
import matplotlib.pyplot as plt

#define x and y
x = [1, 6, 10]
y = [5, 13, 27]

#attempt to create line plot of x and y
plt.plot(x, y)
Here’s what the output looks like in the Jupyter notebook:
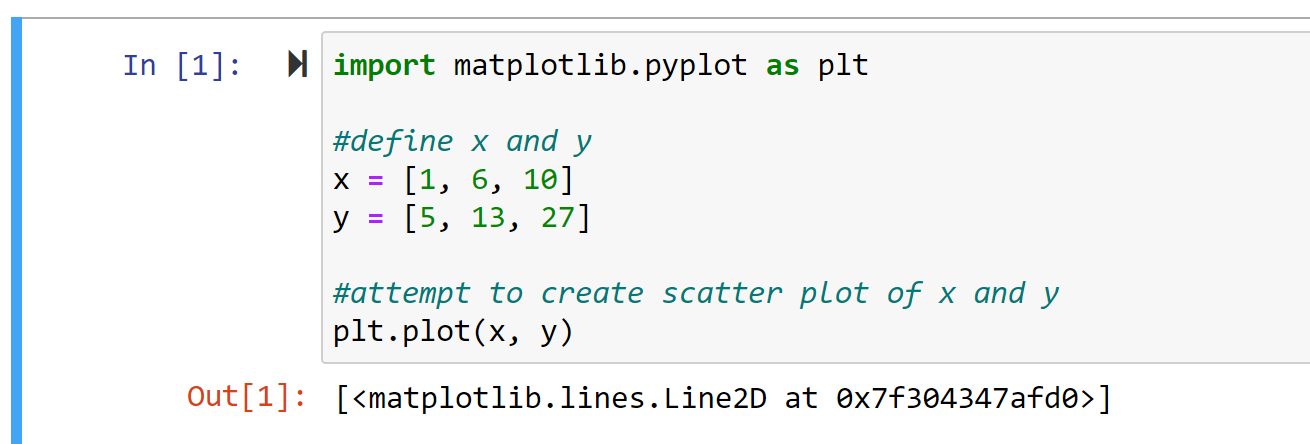
The code runs without any errors, but no line plot is displayed inline with the code.
To fix this, we can use the %matplotlib inline command before we create the line plot:
%matplotlib inline

import matplotlib.pyplot as plt

#define x and y
x = [1, 6, 10]
y = [5, 13, 27]

#create scatter plot of x and y
plt.plot(x, y)
Here’s what the output looks like in the Jupyter notebook:
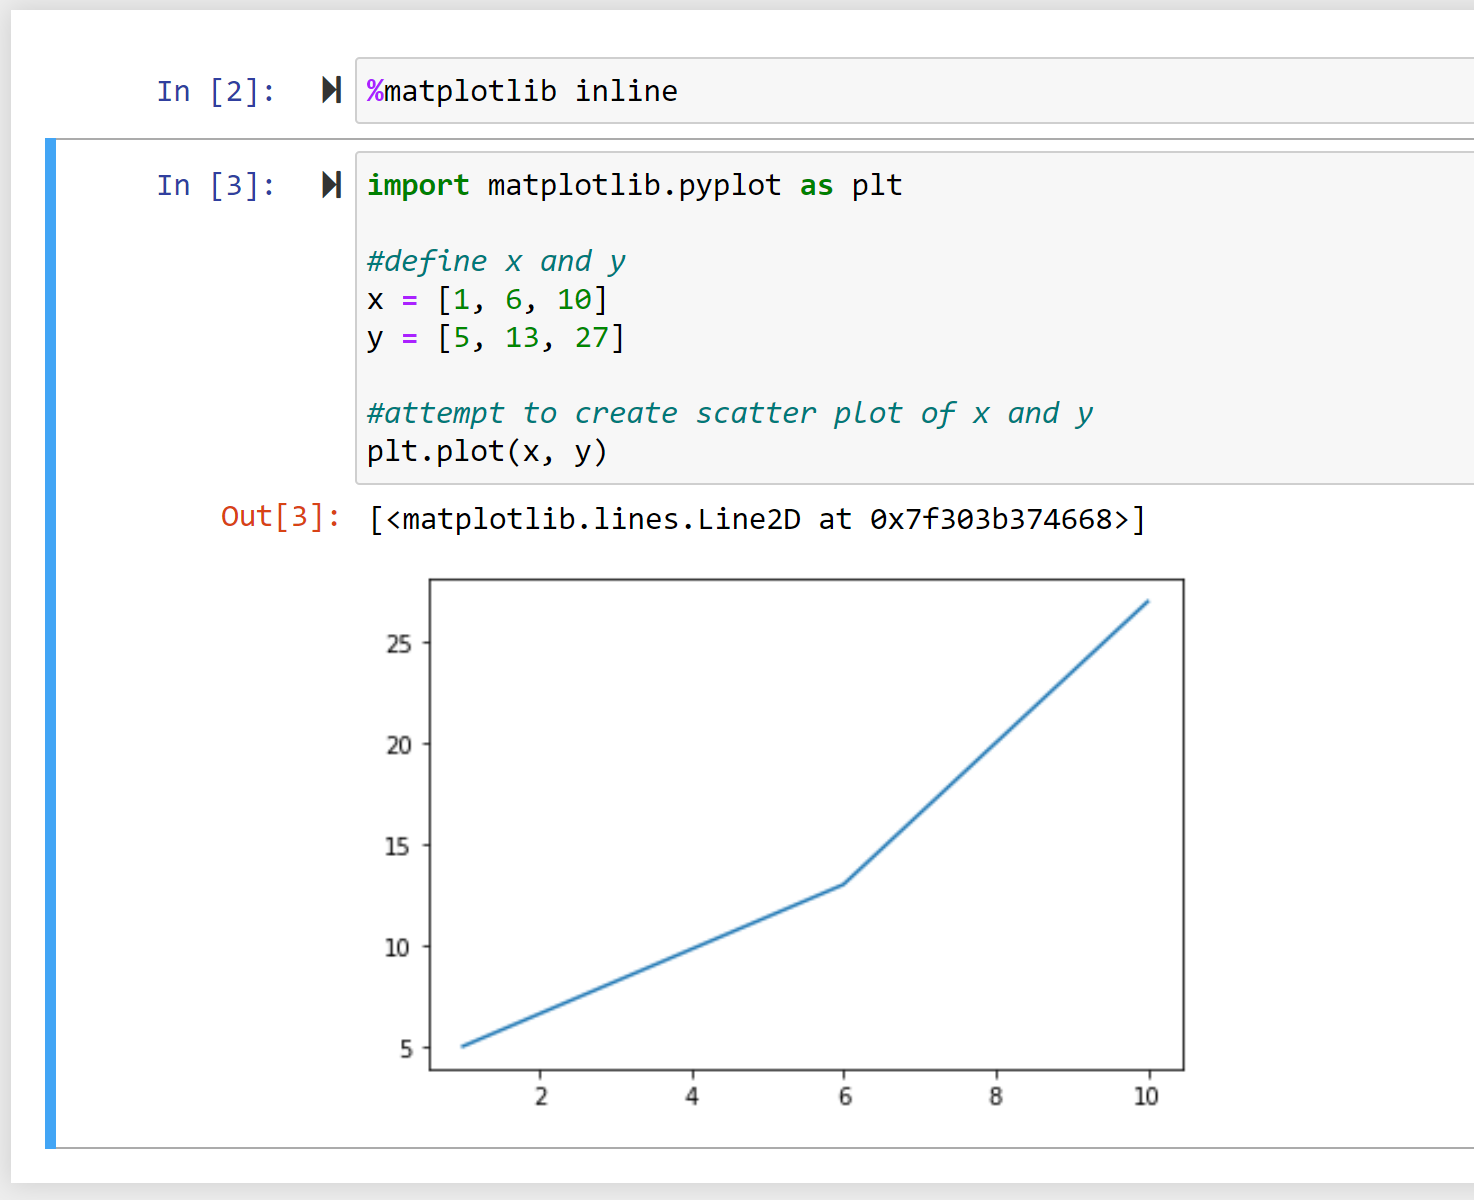
Notice that the code runs without any errors again and the plot is displayed inline in the notebook.
Note that once we’ve used %matplotlib inline, any Matplotlib plots that we create in any future cells in the notebook will also be displayed and store within the notebook.
Additional Resources
The following tutorials explain how to perform other common operations in Python:
How to Fix KeyError in Pandas
How to Fix: ValueError: cannot convert float NaN to integer
How to Fix: ValueError: operands could not be broadcast together with shapes