You can use the following syntax to increase the size of a single plot in Matplotlib:
import matplotlib.pyplot as plt

#define figure size in (width, height) for a single plot
plt.figure(figsize=(3,3))
And you can use the following syntax to increase the size of all Matplotlib plots in a notebook:
import matplotlib.pyplot as plt

#define figure size in (width, height) for all plots
plt.rcParams['figure.figsize'] = [10, 7]
The following examples show how to use this syntax in practice.
Example 1: Increase Size of a Single Matplotlib Plot
Suppose we create the following line plot in Matplotlib:
import matplotlib.pyplot as plt

#define x and y
x = [1, 6, 10]
y = [5, 13, 27]

#create plot of x and y
plt.plot(x, y)
plt.show()
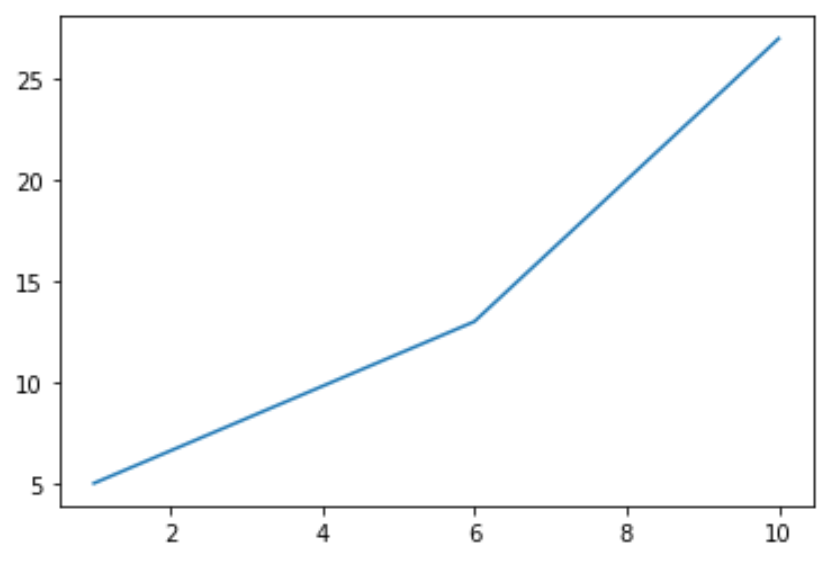
By default, the (width, height) of a Matplotlib plot is (6.4, 4.8).
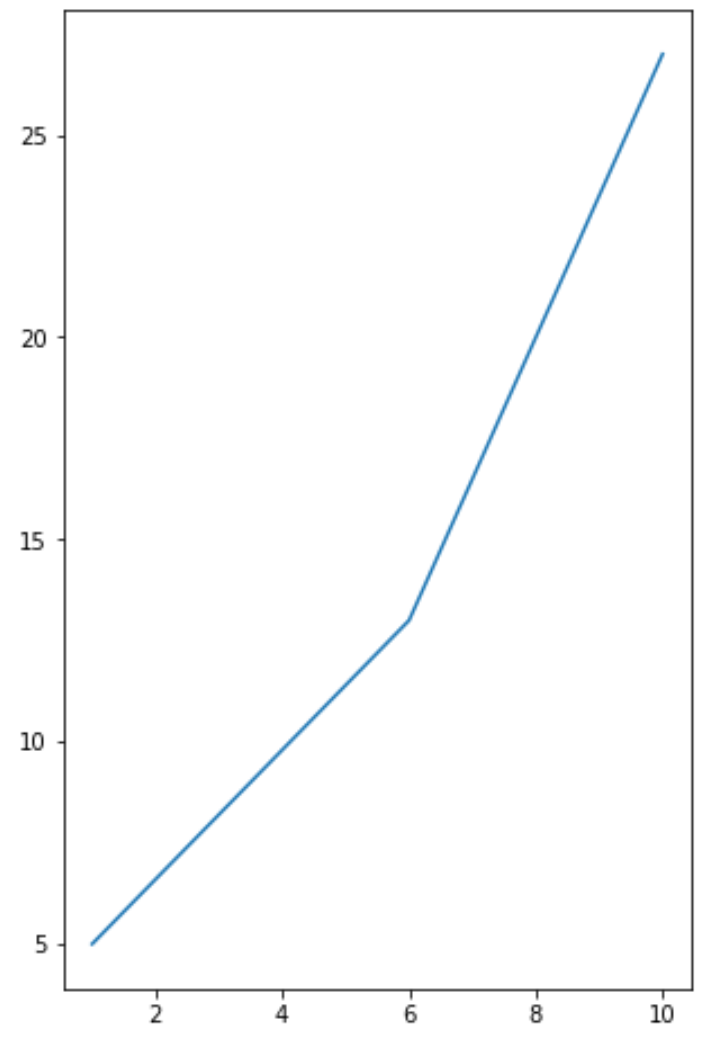
However, we can use the following syntax to increase the plot size to whatever dimensions we’d like:
import matplotlib.pyplot as plt

#define plot size
plt.figure(figsize=(5,8))

#define x and y
x = [1, 6, 10]
y = [5, 13, 27]

#create plot of x and y
plt.plot(x, y)
plt.show()
Example 2: Increase Size of All Matplotlib Plots
The following code shows how to set the plot size for all Matplotlib plots in a notebook:
import matplotlib.pyplot as plt

#define plot size for all plots
plt.rcParams['figure.figsize'] = [10, 4]

#define first dataset
x = [1, 6, 10]
y = [5, 13, 27]

#create first plot
plt.plot(x, y)
plt.show()

#define second dataset
x2 = [1, 6, 10]
y2 = [5, 19, 12]

#create second plot
plt.plot(x2, y2)
plt.show()
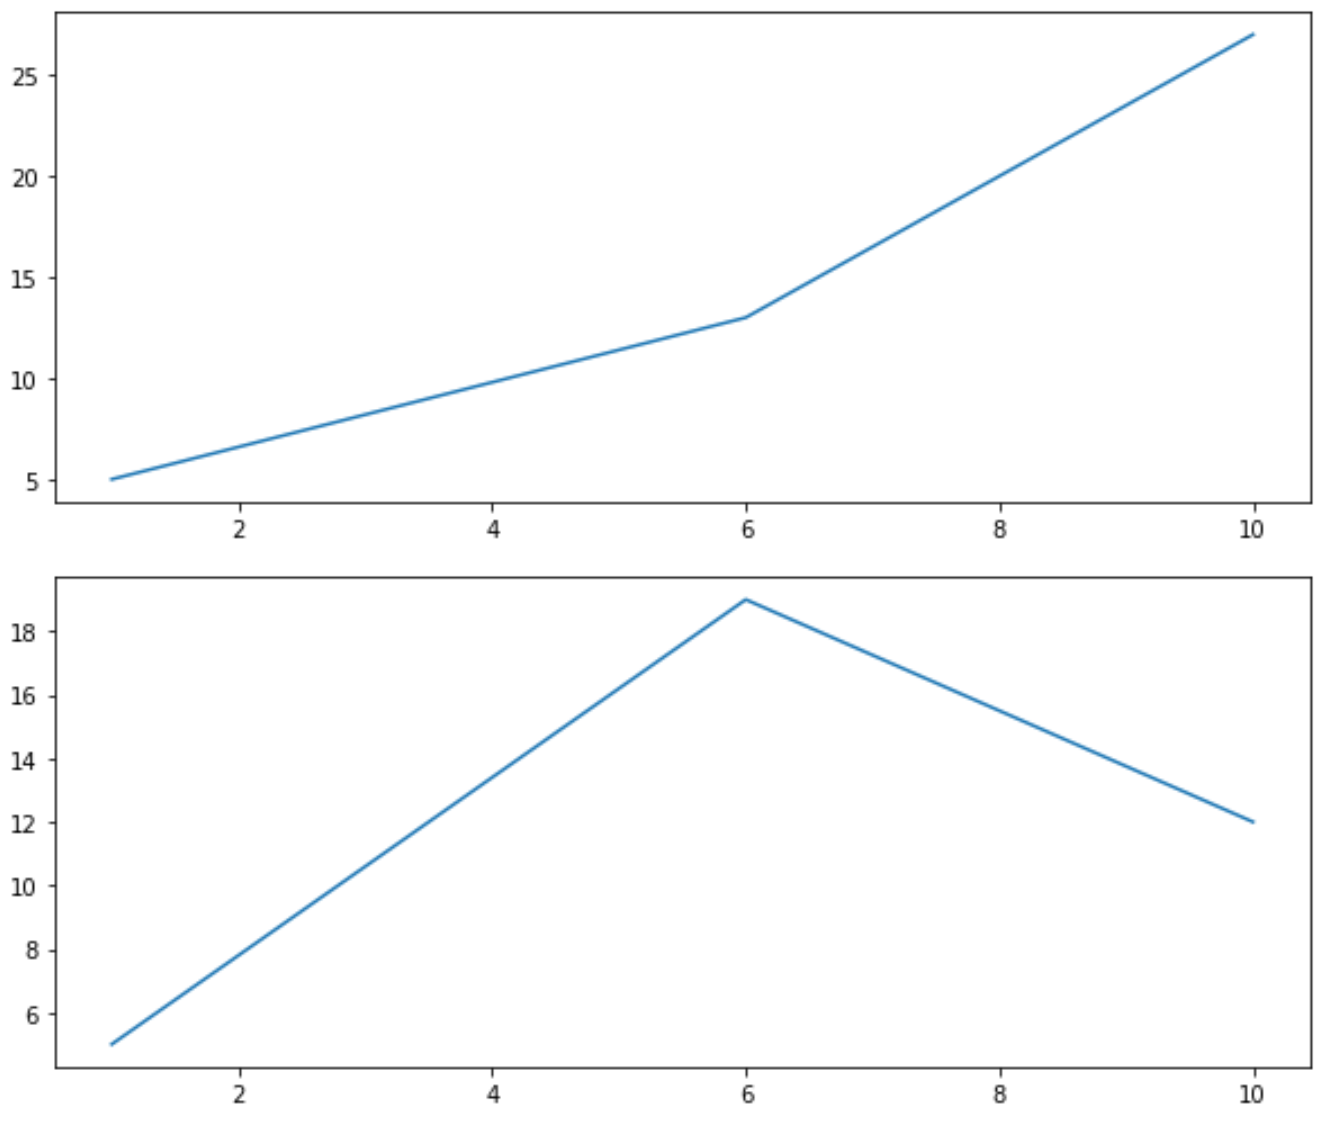
Notice that both plots have the width and height specified by the rcParams arguments.
Additional Resources
How to Adjust Marker Size in Matplotlib
How to Change Font Sizes in Matplotlib
How to Adjust Line Thickness in Matplotlib