You can easily fill in the area between values in a Matplotlib plot by using following functions:
- fill_between(): Fill the area between two horizontal curves.
- fill_betweenx(): Fill the area between two vertical curves.
This tutorial provides examples of how to use each of these functions in practice.
Example 1: Fill in Area Between Two Horizontal Lines
The following code shows how to fill in the area between two horizontal lines:
import matplotlib.pyplot as plt
import numpy as np

#define x and y values
x = np.arange(0,10,0.1)
y = np.arange(10,20,0.1)

#create plot of values
plt.plot(x,y)

#fill in area between the two lines
plt.fill_between(x, y, color='red')

Note that we can also use the plt.grid() function to add gridlines to the plot to see the values that are being filled in more easily:
import matplotlib.pyplot as plt
import numpy as np

#define x and y values
x = np.arange(0,10,0.1)
y = np.arange(10,20,0.1)

#create plot of values
plt.plot(x,y)

#fill in area between the two lines
plt.fill_between(x, y, color='red', alpha=.5)

#add gridlines
plt.grid()

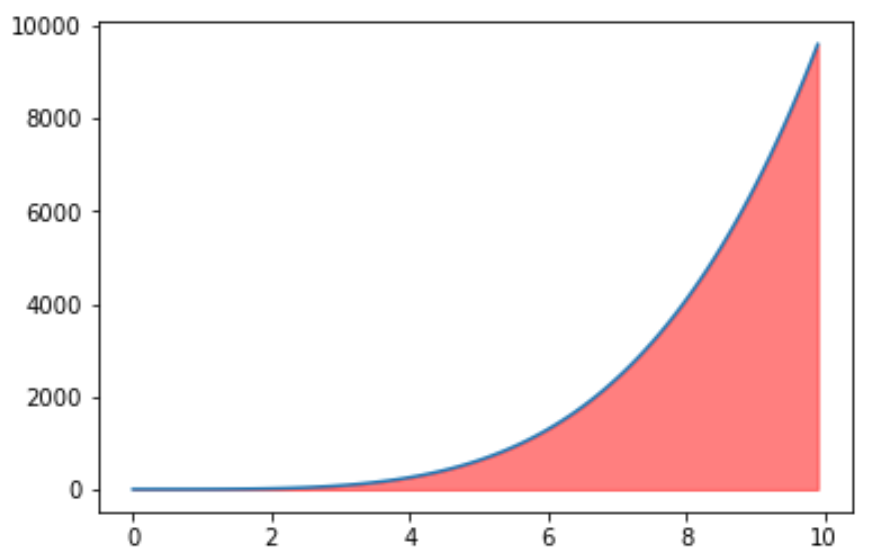
Example 2: Fill in Area Under a Curve
The following code show to fill in the area under a curve:
import matplotlib.pyplot as plt
import numpy as np

#define x and y values
x = np.arange(0,10,0.1)
y = x**4

#create plot of values
plt.plot(x,y)

#fill in area between the two lines
plt.fill_between(x, y, color='red', alpha=.5)
Example 3: Fill in Area Above a Curve
The following code show to fill in the area above a curve:
import matplotlib.pyplot as plt
import numpy as np

#define x and y values
x = np.arange(0,10,0.1)
y = x**4

#create plot of values
plt.plot(x,y)

#fill in area between the two lines
plt.fill_between(x, y, np.max(y), color='red', alpha=.5)

Example 4: Fill in Area Between Two Vertical Lines
The following code shows how to use the fill_betweenx() function to fill in the area between two vertical lines:
import matplotlib.pyplot as plt
import numpy as np

#define x and y values
x = np.arange(0,10,0.1)
y = np.arange(10,20,0.1)

#create plot of values
plt.plot(x,y)

#fill in area between the two lines
plt.fill_betweenx(y, 2, 4, color='red', alpha=.5)
