In Python, Matplotlib has a list of default colors that it uses for the elements in a plot depending on the number of total elements.
For example, we can use the following code to plot lines that show the first 10 default colors in Matplotlib:
import numpy as np
import matplotlib.pyplot as plt

#define plot
fig = plt.figure()
ax = fig.add_subplot(111)

#define range
j = np.arange(11)

#add lines to plot
for i in range(10):
    line, = ax.plot(j,i*(j+1))
    ax.plot(j,i*(j+1), color = line.get_color())

#display plot
plt.show()
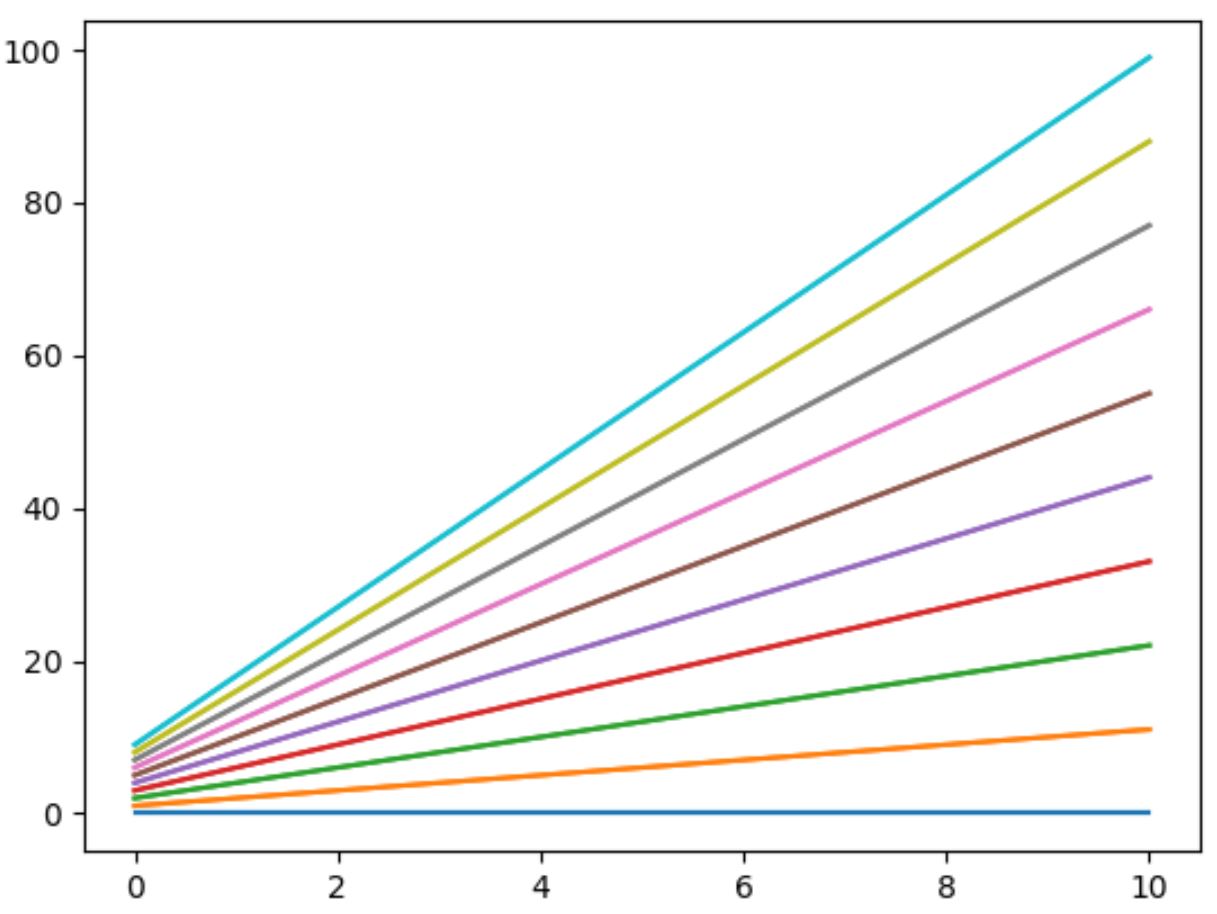
Matplotlib chooses the first 10 default colors for the lines in the plot.
We can use the following code to view the actual hex color codes of each of the ten colors:
import matplotlib.pyplot as plt

#display hex color codes
print(plt.rcParams['axes.prop_cycle'].by_key()['color'])

['#1f77b4', '#ff7f0e', '#2ca02c', '#d62728', '#9467bd', '#8c564b', '#e377c2',
 '#7f7f7f', '#bcbd22', '#17becf']
The output displays the hex color code for each of the ten default colors.
For example, the first hex color code is #1f77b4. This corresponds to the first line in the plot that is blue.
The second hex color code is #ff7f0e. This corresponds to the second line in the plot that is orange.
The third hex color code is #2ca02c. This corresponds to the third line in the plot that is green.
And so on.
This means if you create a plot in Matplotlib with one line, then the color of the line will be #1f77b4 unless you specify otherwise.
Or if you create a plot in Matplotlib with two lines, the color of the first line will be #1f77b4 and the color of the second line will be #ff7f0e unless you specify otherwise.
Refer to the Matplotlib documentation for a complete explanation of the default colors.
Additional Resources
The following tutorials explain how to perform other common tasks in Matplotlib:
How to Change Background Color in Matplotlib
How to Plot Only Horizontal Gridlines in Matplotlib
How to Set Axis Ticks in Matplotlib