You can use the weight argument to create a bold font in Matplotlib.
This argument is commonly used with titles and annotated text in Matplotlib:
Method 1: Use Bold Font in Title
plt.title('My Title', weight='bold')
Method 2: Use Bold Font in Annotated Text
plt.text(6, 10, 'some text', weight='bold')
The following examples show how to use each method in practice.
Example 1: Use Bold Font in Title
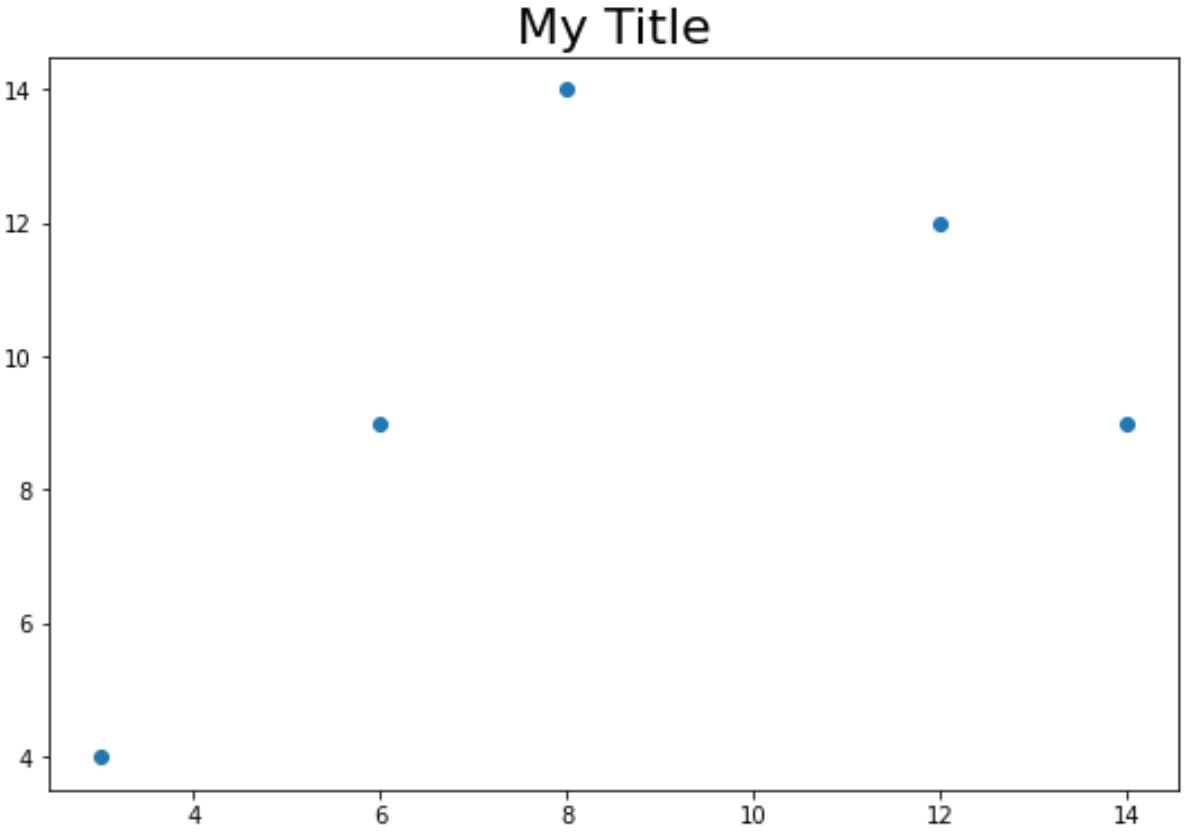
The following code shows how to create a scatterplot with a title in Matplotlib that uses regular font:
import matplotlib.pyplot as plt

#create data
x = [3, 6, 8, 12, 14]
y = [4, 9, 14, 12, 9]

#create scatterplot
plt.scatter(x, y)

#add title
plt.title('My Title', fontsize=22)
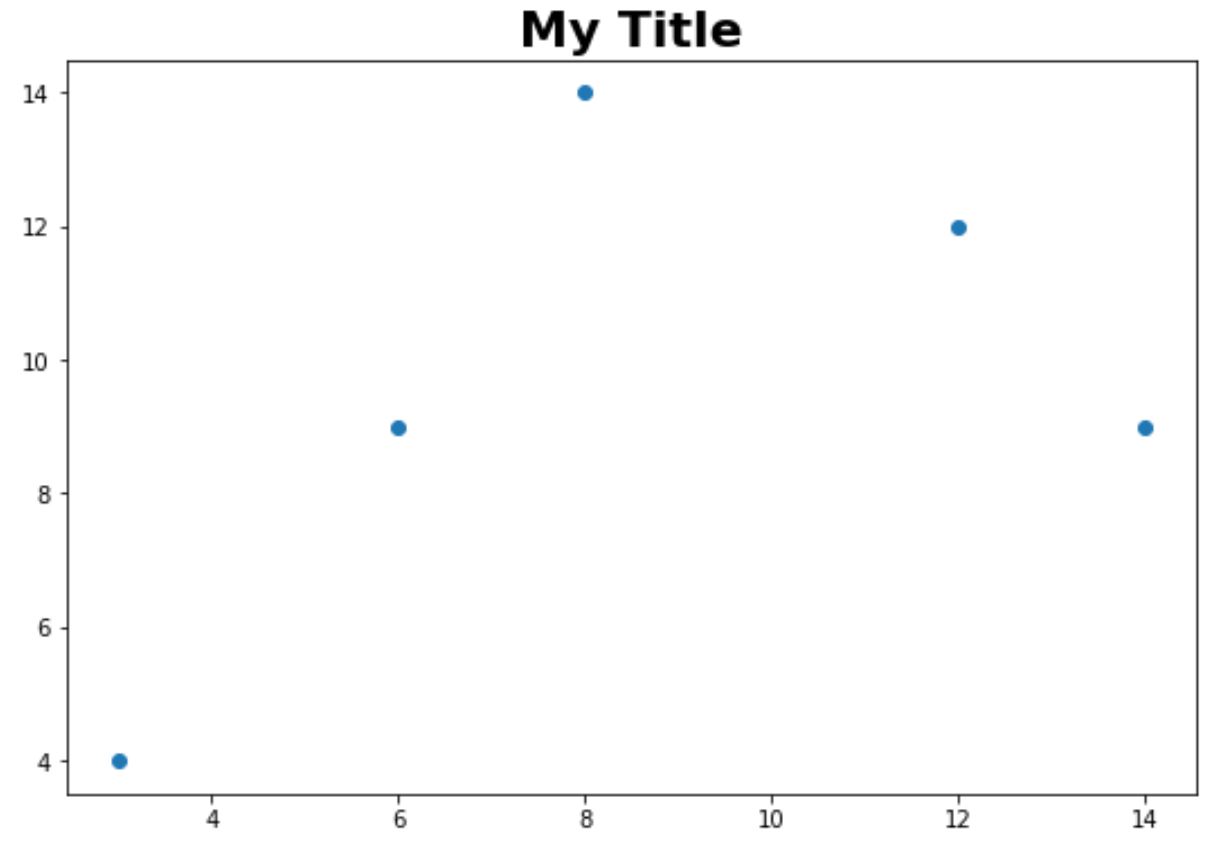
And the following code shows how to create a scatterplot with a title in Matplotlib and use the weight argument to enable bold font:
import matplotlib.pyplot as plt

#create data
x = [3, 6, 8, 12, 14]
y = [4, 9, 14, 12, 9]

#create scatterplot
plt.scatter(x, y)

#add title
plt.title('My Title', fontsize=22, weight='bold')
Example 2: Use Bold Font in Annotated Text
The following code shows how to use the weight argument to enable bold font in an annotated text in a Matplotlib scatterplot:
import matplotlib.pyplot as plt

#create data
x = [3, 6, 8, 12, 14]
y = [4, 9, 14, 12, 9]

#create scatterplot
plt.scatter(x, y)

#add regular text
plt.text(6, 10, 'Normal Font',  fontsize=16)

#add bold text
plt.text(10, 10, 'Bold Font', fontsize=16, weight='bold')
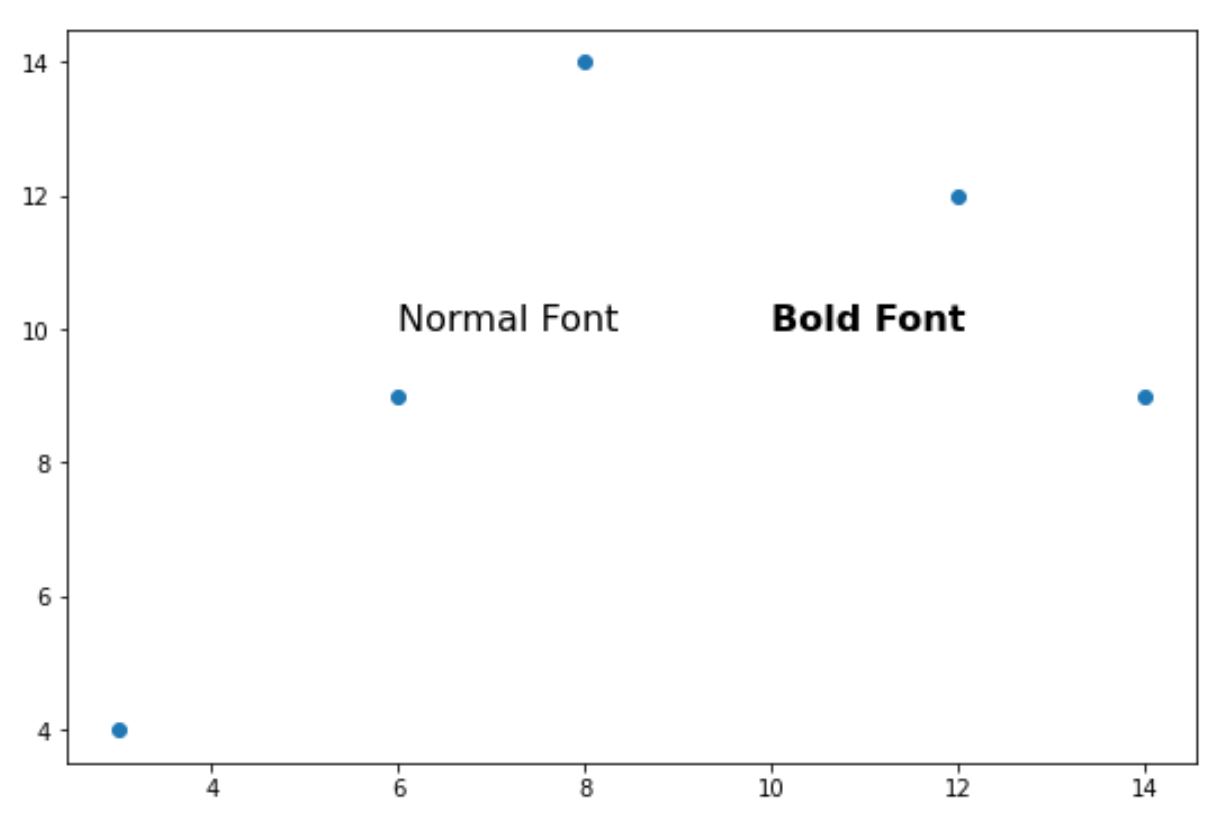
Notice the difference between the normal font and the bold font.
Additional Resources
The following tutorials explain how to perform other common tasks in Matplotlib:
How to Add Legend to Scatterplot in Matplotlib
How to Color a Scatterplot by Value in Matplotlib
How to Add an Average Line to Plots in Matplotlib