You can use the following basic syntax to add an average line to a plot in Matplotlib:
import matplotlib.pyplot as plt
import numpy as np

#create scatter plot
plt.scatter(df.x, df.y)

#add horizontal line at mean value of y
plt.axhline(y=np.nanmean(df.y))
Note that axhline adds a horizontal line to the plot and nanmean calculates the average value (ignoring NaNs) where the line should be placed.
The following example shows how to use this syntax in practice.
Example: Add Average Line to Plot in Matplotlib
Suppose we have the following pandas DataFrame:
import pandas as pd

#create DataFrame
df = pd.DataFrame({'x': [1, 2, 3, 4, 5, 6, 7, 8, 9, 10, 11, 12],
                   'y':[2, 5, 6, 5, 7, 8, 10, 12, 10, 9, 11, 15]})

#view first five rows of DataFrame
df.head()

	x	y
0	1	2
1	2	5
2	3	6
3	4	5
4	5	7
We can use the following code to create a scatter plot of x vs. y and add a horizontal line that represents the average y-value:
import matplotlib.pyplot as plt
import numpy as np

#create scatter plot
plt.scatter(df.x, df.y)

#add horizontal line at mean value of y
plt.axhline(y=np.nanmean(df.y))
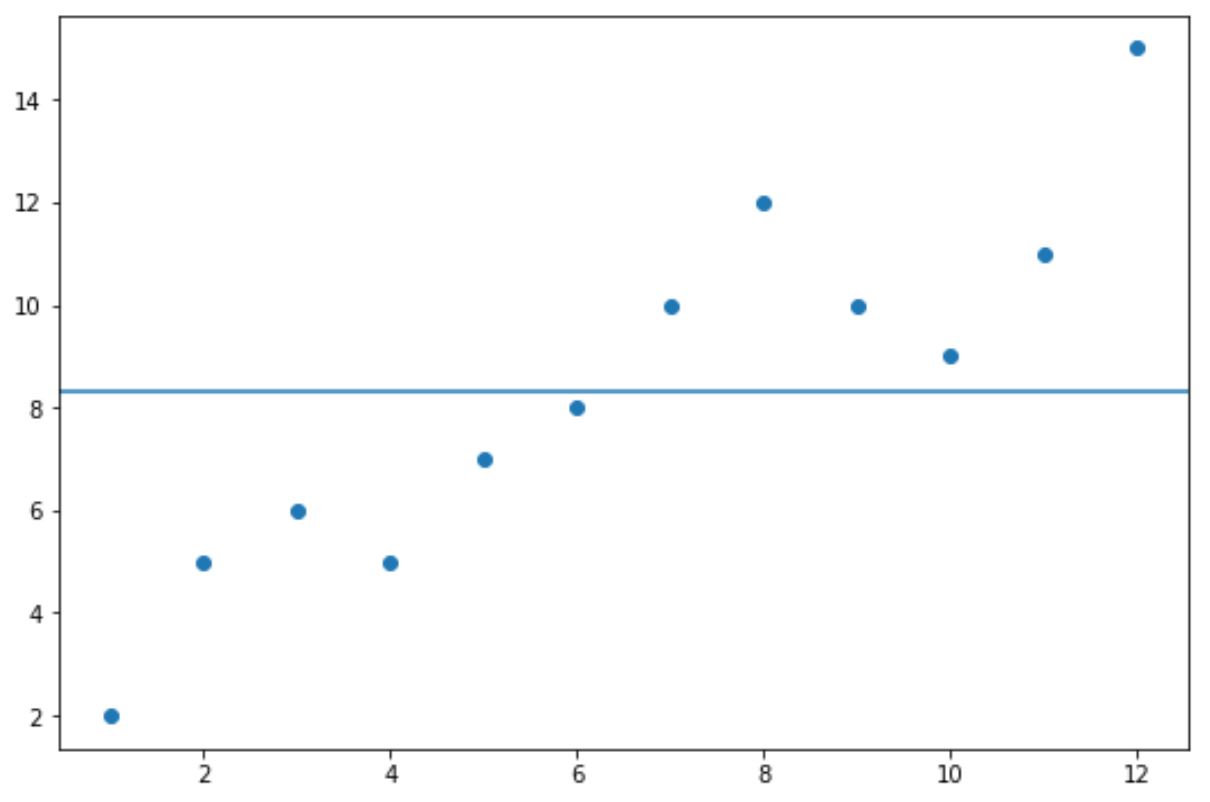
We can see that an average line has been added to the plot just above the y-value of 8.
If we calculate the average y-value, we’ll find that it’s 8.333:
#calculate average y-value
np.nanmean(df.y)

8.333333333
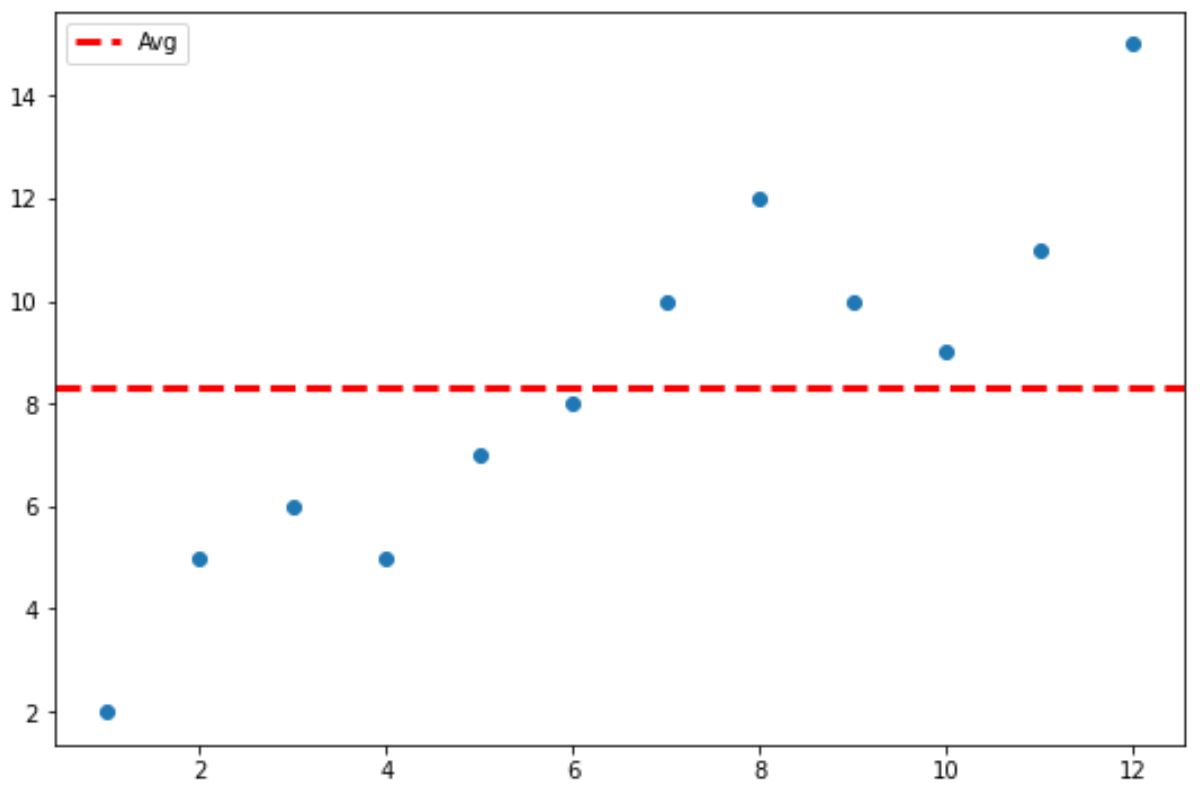
Note that we can also use the color, linestyle, and linewidth arguments to specify the color, line type, and line width of the average line, respectively:
import matplotlib.pyplot as plt
import numpy as np

#create scatter plot
plt.scatter(df.x, df.y)

#add horizontal line at mean value of y
plt.axhline(y=np.nanmean(df.y), color='red', linestyle='--', linewidth=3, label='Avg')
Note: You can find the complete online documentation for the axhline() function here.
Additional Resources
The following tutorials explain how to perform other common tasks in Matplotlib:
How to Add a Trendline in Matplotlib
How to Draw a Vertical Line in Matplotlib
How to Plot Multiple Lines in Matplotlib