You can use the following basic syntax to annotate scatter plots in Matplotlib:
#add 'my text' at (x, y) coordinates = (6, 9.5)
plt.text(6, 9.5, 'my text')
The following examples show how to use this syntax in practice.
Create Basic Scatterplot
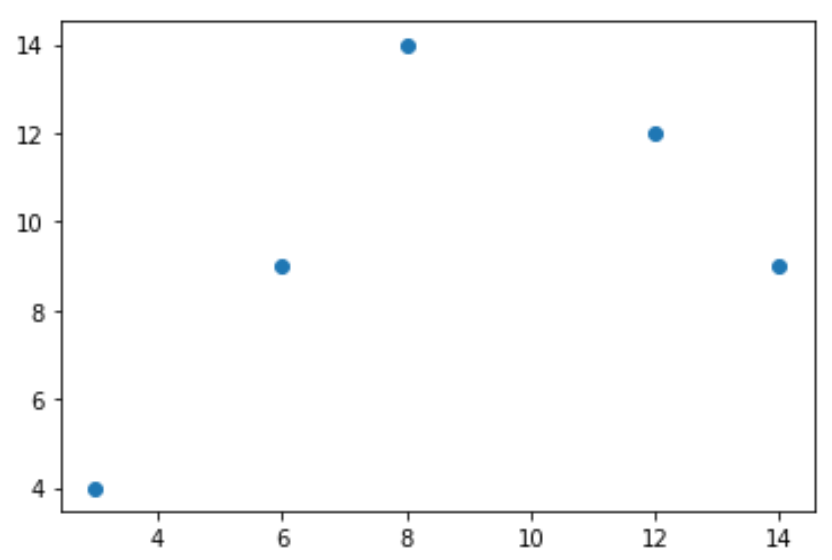
The following code shows how to create a basic scatterplot using Matplotlib:
import matplotlib.pyplot as plt

#create data
x = [3, 6, 8, 12, 14]
y = [4, 9, 14, 12, 9]

#create scatterplot
plt.scatter(x, y)
Annotate a Single Point
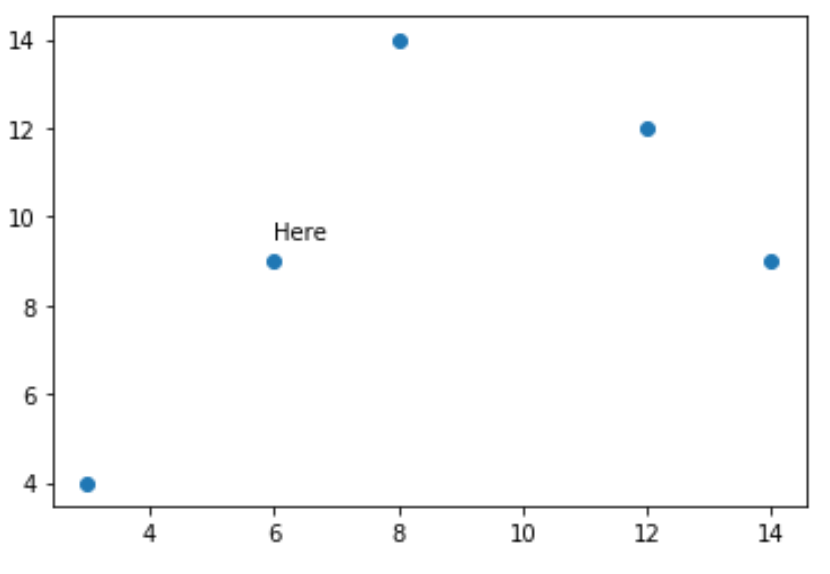
We can use the following code to add an annotation to a single point in the plot:
import matplotlib.pyplot as plt

#create data
x = [3, 6, 8, 12, 14]
y = [4, 9, 14, 12, 9]

#create scatterplot
plt.scatter(x, y)

#add text 'Here' at (x, y) coordinates = (6, 9.5)
plt.text(6, 9.5, 'Here')
Annotate Multiple Points
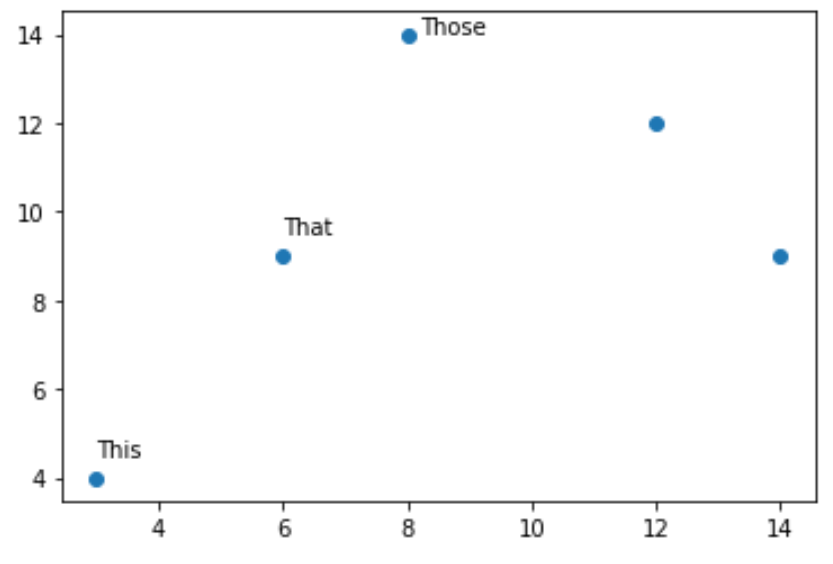
We can use the following code to add annotations to multiple points in the plot:
import matplotlib.pyplot as plt

#create data
x = [3, 6, 8, 12, 14]
y = [4, 9, 14, 12, 9]

#create scatterplot
plt.scatter(x, y)

#add text to certain points
plt.text(3, 4.5, 'This')
plt.text(6, 9.5, 'That')
plt.text(8.2, 14, 'Those')
Annotate All Points
We can use the following code to add annotations to every single point in the plot:
import matplotlib.pyplot as plt

#create data
x = [3, 6, 8, 12, 14]
y = [4, 9, 14, 12, 9]
labs = ['A', 'B', 'C', 'D', 'E']

#create scatterplot
plt.scatter(x, y)

#use for loop to add annotations to each point in plot
for i, txt in enumerate(labs):
    plt.annotate(txt, (x[i], y[i]))
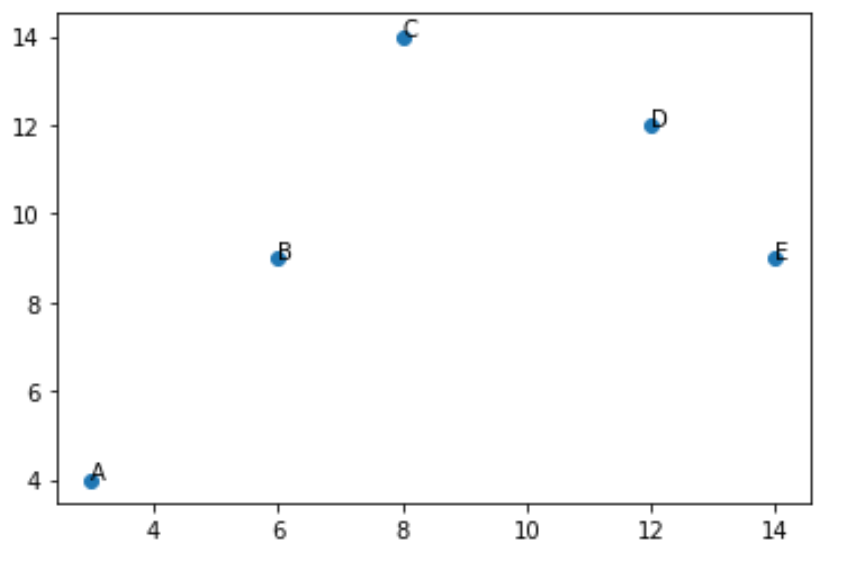
By default, the annotations are placed directly on top of the points in the scatterplot and the default font size is 10.
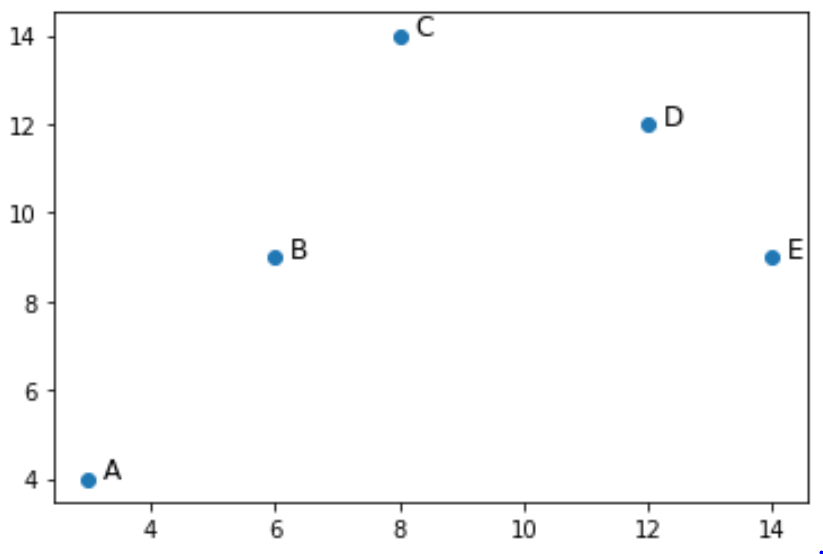
The following code shows how to adjust both of these settings so the annotations are slightly to the right of the points and the font size is slightly larger:
import matplotlib.pyplot as plt

#create data
x = [3, 6, 8, 12, 14]
y = [4, 9, 14, 12, 9]
labs = ['A', 'B', 'C', 'D', 'E']

#create scatterplot
plt.scatter(x, y)

#use for loop to add annotations to each point in plot
for i, txt in enumerate(labs):
    plt.annotate(txt, (x[i]+.25, y[i]), fontsize=12)
Additional Resources
The following tutorials explain how to perform other common tasks in Matplotlib:
How to Add Legend to Scatterplot in Matplotlib
How to Color a Scatterplot by Value in Matplotlib
How to Add an Average Line to Plots in Matplotlib