You can easily add text to a Matplotlib plot by using the matplotlib.pyplot.text() function, which uses the following syntax:
matplotlib.pyplot.text(x, y, s, fontdict=None)
where:
- x: The x-coordinate of the text
- y: The y-coordinate of the text
- s: The string of text
- fontdict: A dictionary to override the default text properties
This tutorial shows several examples of how to use this function in practice.
Example 1: Add a Single Text to a Matplotlib Plot
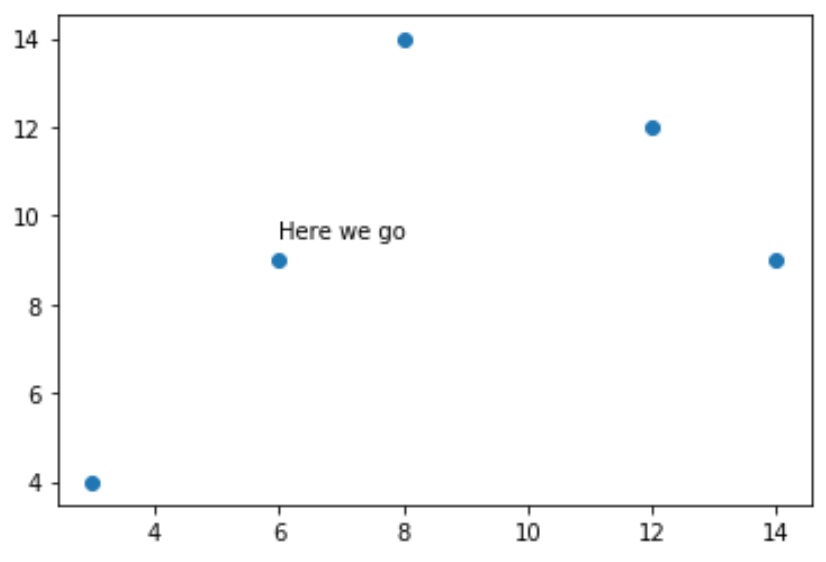
The following code shows how to create a scatterplot and add a single piece of text to the plot:
import matplotlib.pyplot as plt

#create data
x = [3, 6, 8, 12, 14]
y = [4, 9, 14, 12, 9]

#create scatterplot
plt.scatter(x, y)

#add text at (x, y) coordinates = (6, 9.5)
plt.text(6, 9.5, 'Here we go')
Example 2: Add Multiple Texts to a Matplotlib Plot
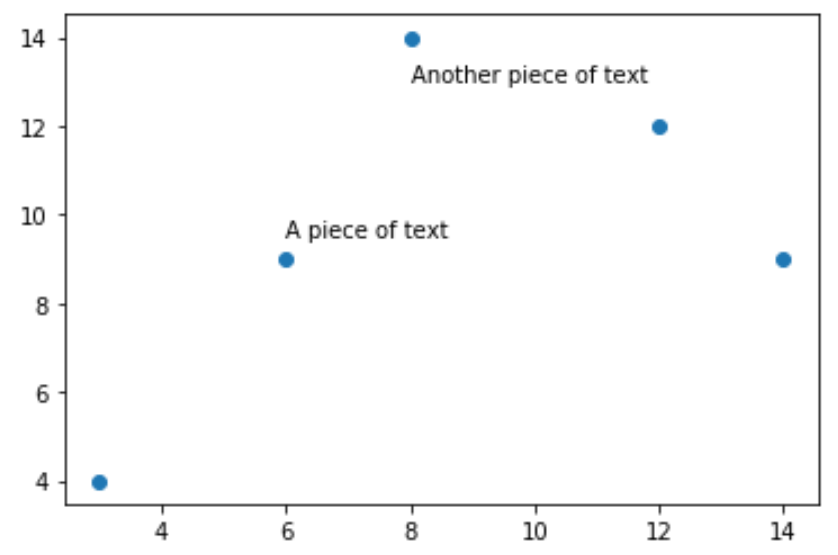
The following code shows how to create a scatterplot and add multiple pieces of text to the plot:
import matplotlib.pyplot as plt

#create data
x = [3, 6, 8, 12, 14]
y = [4, 9, 14, 12, 9]

#create scatterplot
plt.scatter(x, y)

#add text at (x, y) coordinates = (6, 9.5)
plt.text(6, 9.5, 'A piece of text')

#add another piece of text
plt.text(8, 13, 'Another piece of text')
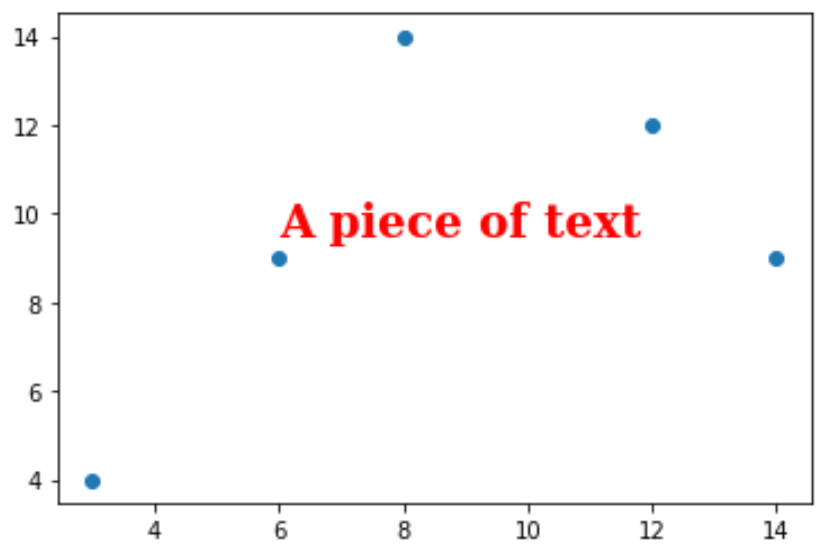
Example 3: Modify the Text Properties
To modify the text properties, we can create a dictionary that specifies the font properties.
The following code shows how to do so:
import matplotlib.pyplot as plt

#create data
x = [3, 6, 8, 12, 14]
y = [4, 9, 14, 12, 9]

#create scatterplot
plt.scatter(x, y)

font = {'family': 'serif',
        'color':  'red',
        'weight': 'bold',
        'size': 20
        }

#add text with custom font
plt.text(6, 9.5, 'A piece of text', fontdict=font)
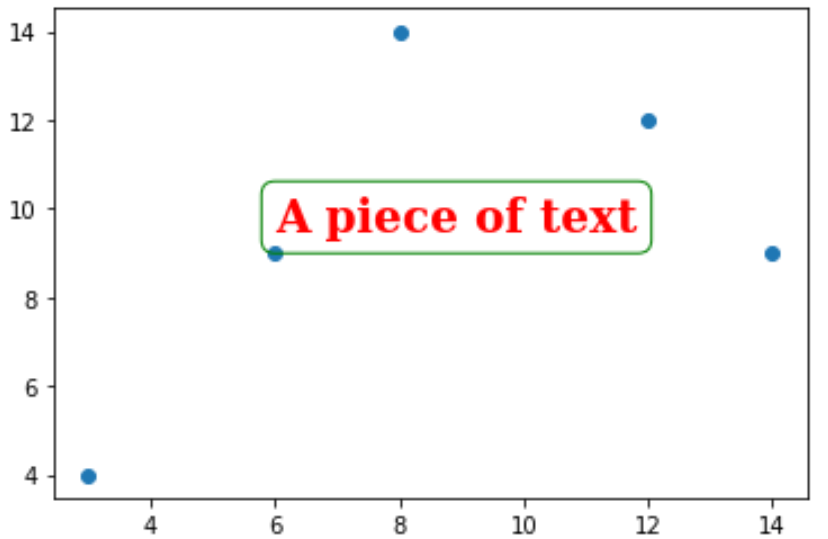
Example 4: Add a Box Around the Text
The following code shows how to add a box around the text:
import matplotlib.pyplot as plt

#create data
x = [3, 6, 8, 12, 14]
y = [4, 9, 14, 12, 9]

#create scatterplot
plt.scatter(x, y)

font = {'family': 'serif',
        'color':  'red',
        'weight': 'bold',
        'size': 20
        }

box = {'facecolor': 'none',
       'edgecolor': 'green',
       'boxstyle': 'round'
      }

#add text with custom font
plt.text(6, 9.5, 'A piece of text', fontdict=font, bbox=box)
Additional Resources
How to Annotate Matplotlib Scatterplots
How to Change Font Sizes on a Matplotlib Plot