A two-way frequency table is a table that displays the frequencies (or “counts”) for two categorical variables.
For example, the following two-way table shows the results of a survey that asked 100 people which sport they liked best: baseball, basketball, or football.
The rows display the gender of the respondent and the columns show which sport they chose:
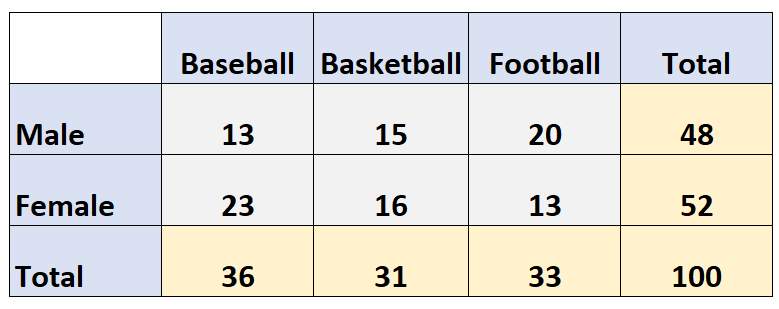
In this example, there are two variables: Sports and Gender.
A marginal distribution is simply the distribution of each of these individual variables. In a two-way table, the marginal distributions are shown in the margins of the table:
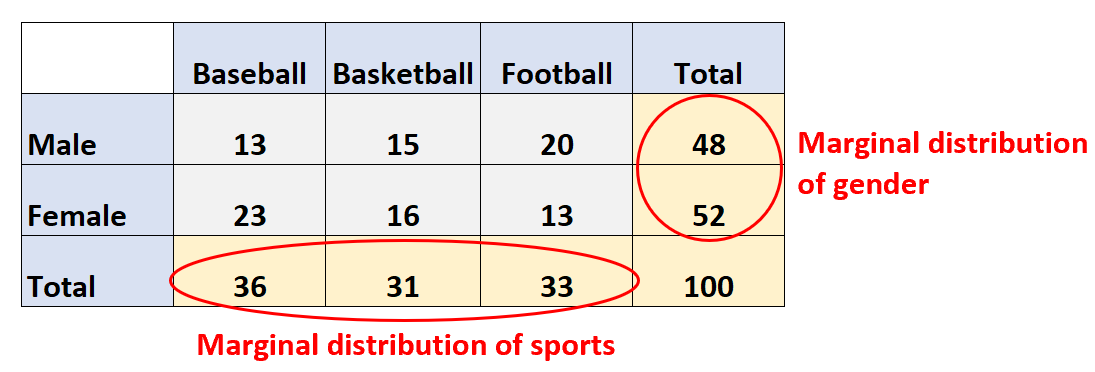
For example, we would say that the marginal distribution of sports is:
- Baseball: 36
- Basketball: 31
- Football: 33
We could also write the marginal distribution of sports in percentage terms (i.e. out of the total of 100 respondents):
- Baseball: 36 / 100 = 36%
- Basketball: 31 / 100 = 31%
- Football: 33 / 100 = 33%
And we would say that the marginal distribution of gender is:
- Male: 48 (or 48%)
- Female: 52 (or 52%)
Note: Marginal distributions always add up to 100%.
Why Use Marginal Distributions?
Marginal distributions are useful because although we often collect data for two variables (like Sports and Gender), sometimes we have specific questions about just one variable.
For example, we might want to know the distribution of survey respondents based purely on gender.
In this case, we could use the marginal distribution to find out that 48% of respondents were male and 52% of respondents were female.
Use the following examples as practice for gaining a better understanding of marginal distributions.
Example 1: Marginal Distributions for Percentages
The following two-way table shows the results of a survey that asked 238 people which movie genre they liked best:
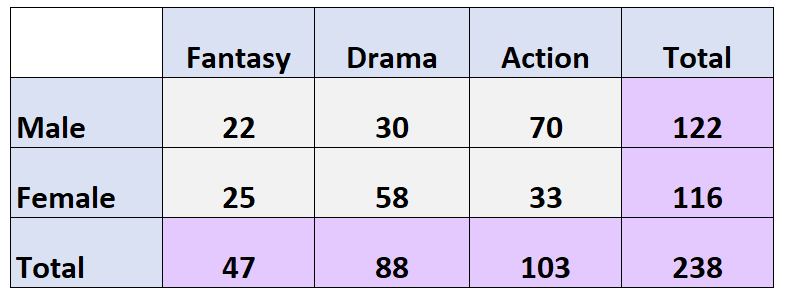
Question: What is the marginal distribution for movie genre (in percentages)?
Answer: The marginal distribution for movie genre is:
- Fantasy: 47/238 = 19.7%
- Drama: 88/238 = 37%
- Action: 103/238 = 43.3%
Question: What is the marginal distribution for gender (in percentages)?
Answer: The marginal distribution for gender is:
- Male: 122/238 = 51.3%
- Female: 116/238 = 48.7%
Example 2: Marginal Distributions for Counts
The following two-way table shows the exam scores of 64 students in a class based on how many hours they spent studying:
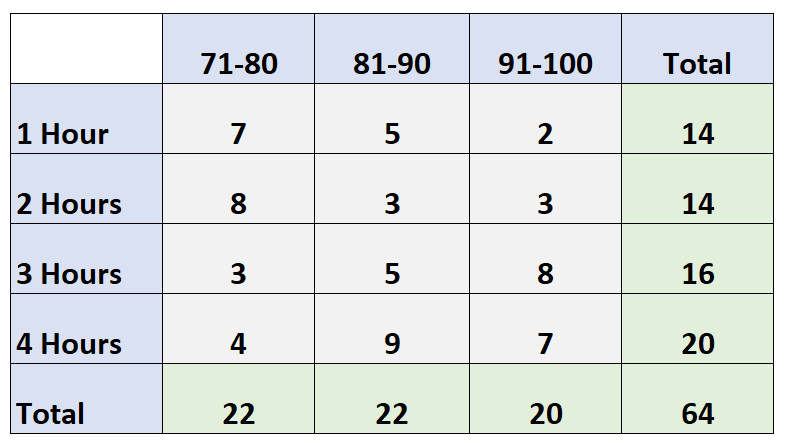
Question: What is the marginal distribution for exam scores (in counts)?
Answer: The marginal distribution for exam scores is:
- 71-80: 22
- 81-90: 22
- 91-100: 20
Question: What is the marginal distribution for hours studied (in counts)?
Answer: The marginal distribution for hours studied is:
- 1 Hour: 14
- 2 Hours: 14
- 3 Hours: 16
- 4 Hours: 20
Notice that the total of the marginal distribution adds up to the table total of 64 students.
Additional Resources
Descriptive vs. Inferential Statistics
Qualitative vs. Quantitative Variables
Levels of Measurement: Nominal, Ordinal, Interval and Ratio