A dataset can be written in two different formats: wide and long.
A wide format contains values that do not repeat in the first column.
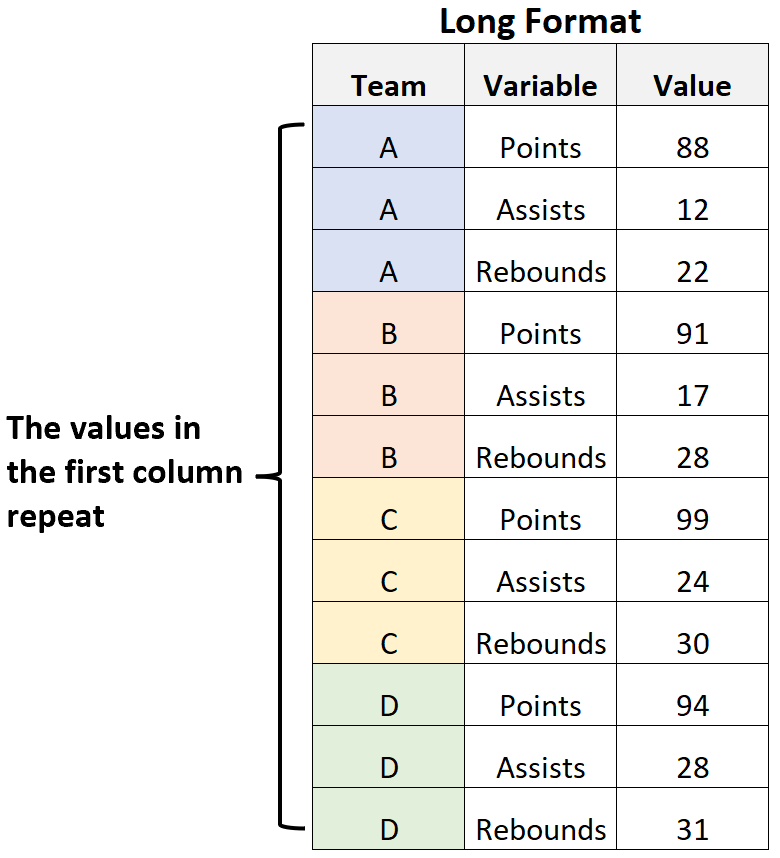
A long format contains values that do repeat in the first column.
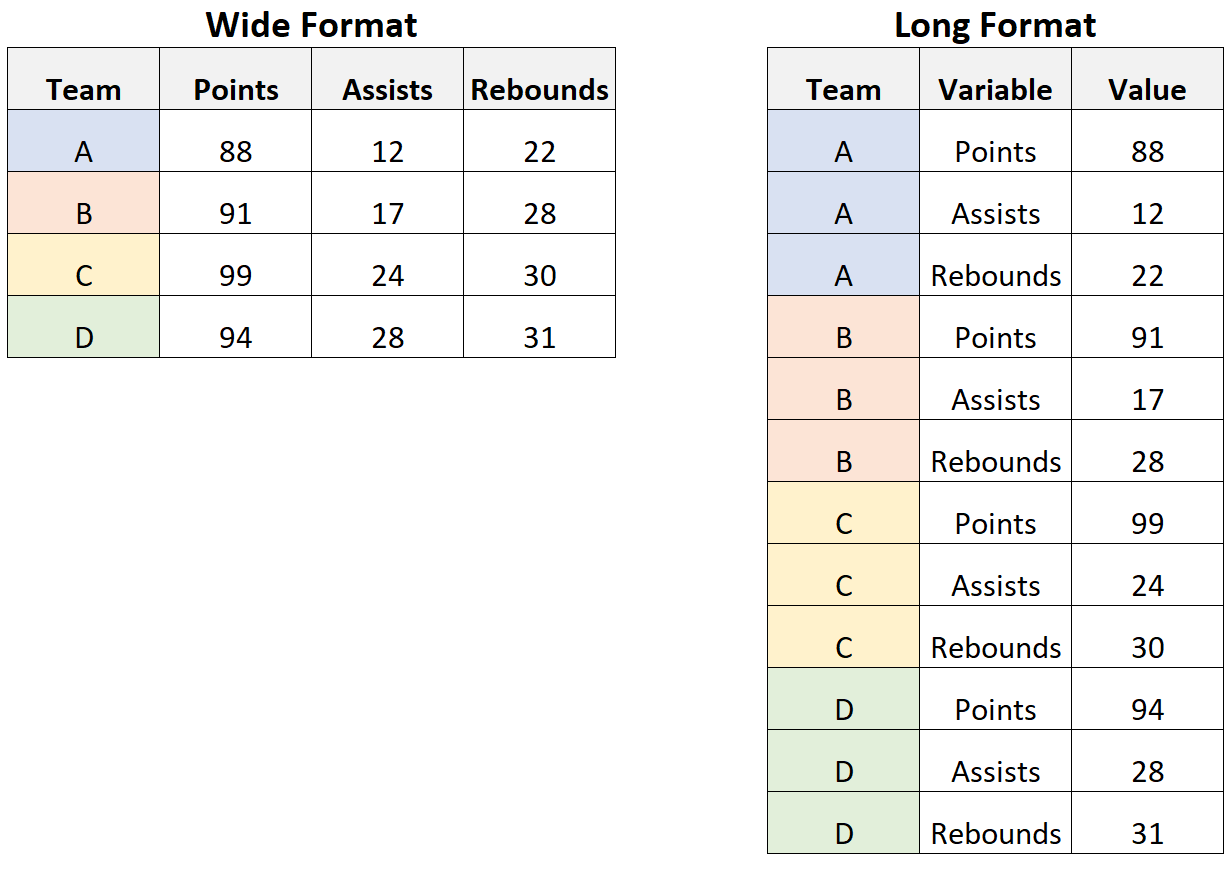
For example, consider the following two datasets that contain the exact same data expressed in different formats:
Notice that in the wide dataset, each value in the first column is unique.
By contrast, in the long dataset the values in the first column repeat.
Both datasets contain the exact same information about the teams, but they’re simply expressed in different formats.
When to Use Wide vs. Long Data
Depending on what you want to do with your data, it may make more sense to have it in a wide or long format.
When to Use Wide Format
As a rule of thumb, if you’re analyzing data then you typically will use a wide data format.
For example, if you want to find the average points, assists, and rebounds scored per team then it’s often easier to have the data in a wide format:
Most datasets that you encounter in the real world will also be recorded in a wide format because it’s easier for our brains to interpret.
For example, in the format above it’s easy to read the points, assists, and rebounds values for each team on the same row.
When to Use Long Format
As a rule of thumb, if you’re visualizing multiple variables in a plot using statistical software such as R you typically must convert your data to a long format in order for the software to create the plot.
For actual examples of this, check out these tutorials in R in which the data must be in a long format to create certain types of plots:
- How to Plot Multiple Density Plots in R
- How to Plot Multiple Columns in R
- How to Create a Heatmap in R
Occasionally you may need to reshape your data into a different format if you’re using Python as well.
The following tutorials explain how to reshape data frames in Python:
Additional Resources
The following tutorials provide information about other commonly used statistical terms:
What is an Observation in Statistics?
What is a Covariate in Statistics?
What Are Residuals in Statistics?


