Logistic regression is a method that we use to fit a regression model when the response variable is binary.
This tutorial explains how to perform logistic regression in Excel.
Example: Logistic Regression in Excel
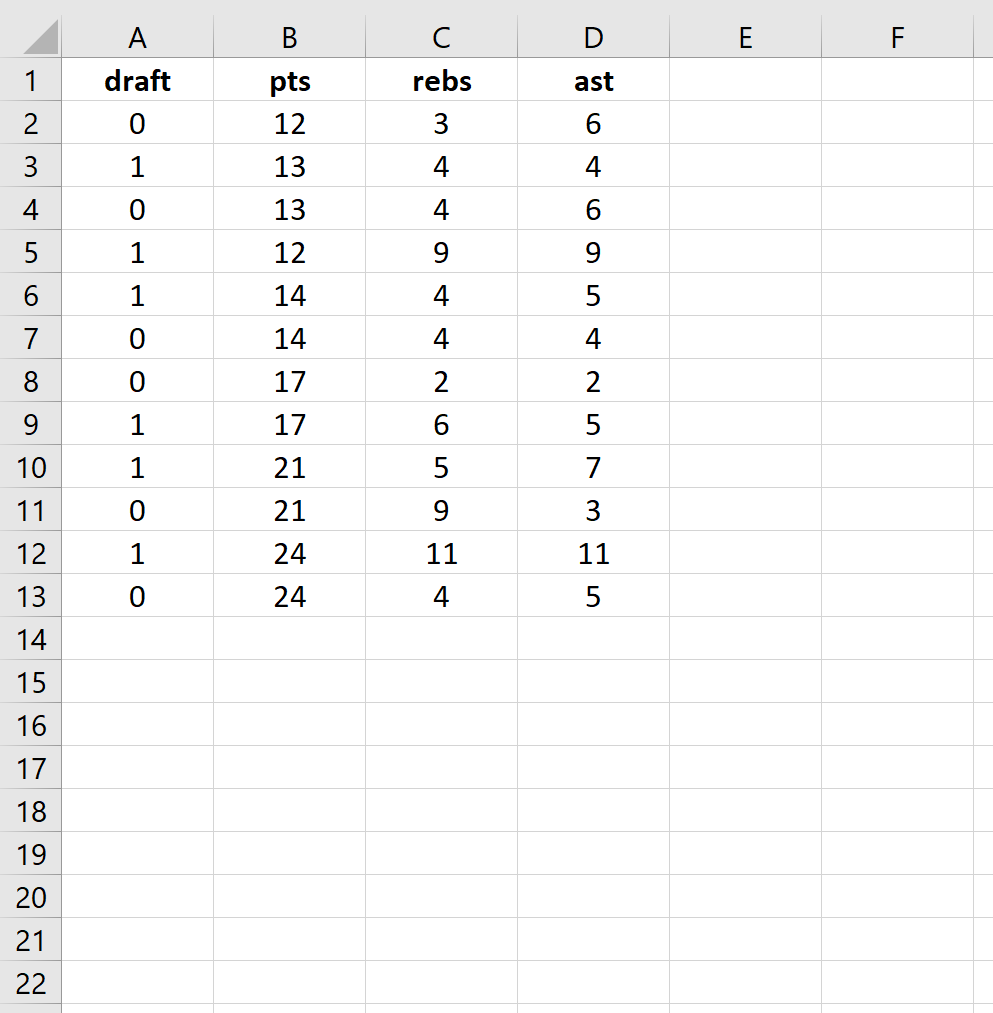
Use the following steps to perform logistic regression in Excel for a dataset that shows whether or not college basketball players got drafted into the NBA (draft: 0 = no, 1 = yes) based on their average points, rebounds, and assists in the previous season.
Step 1: Input the data.
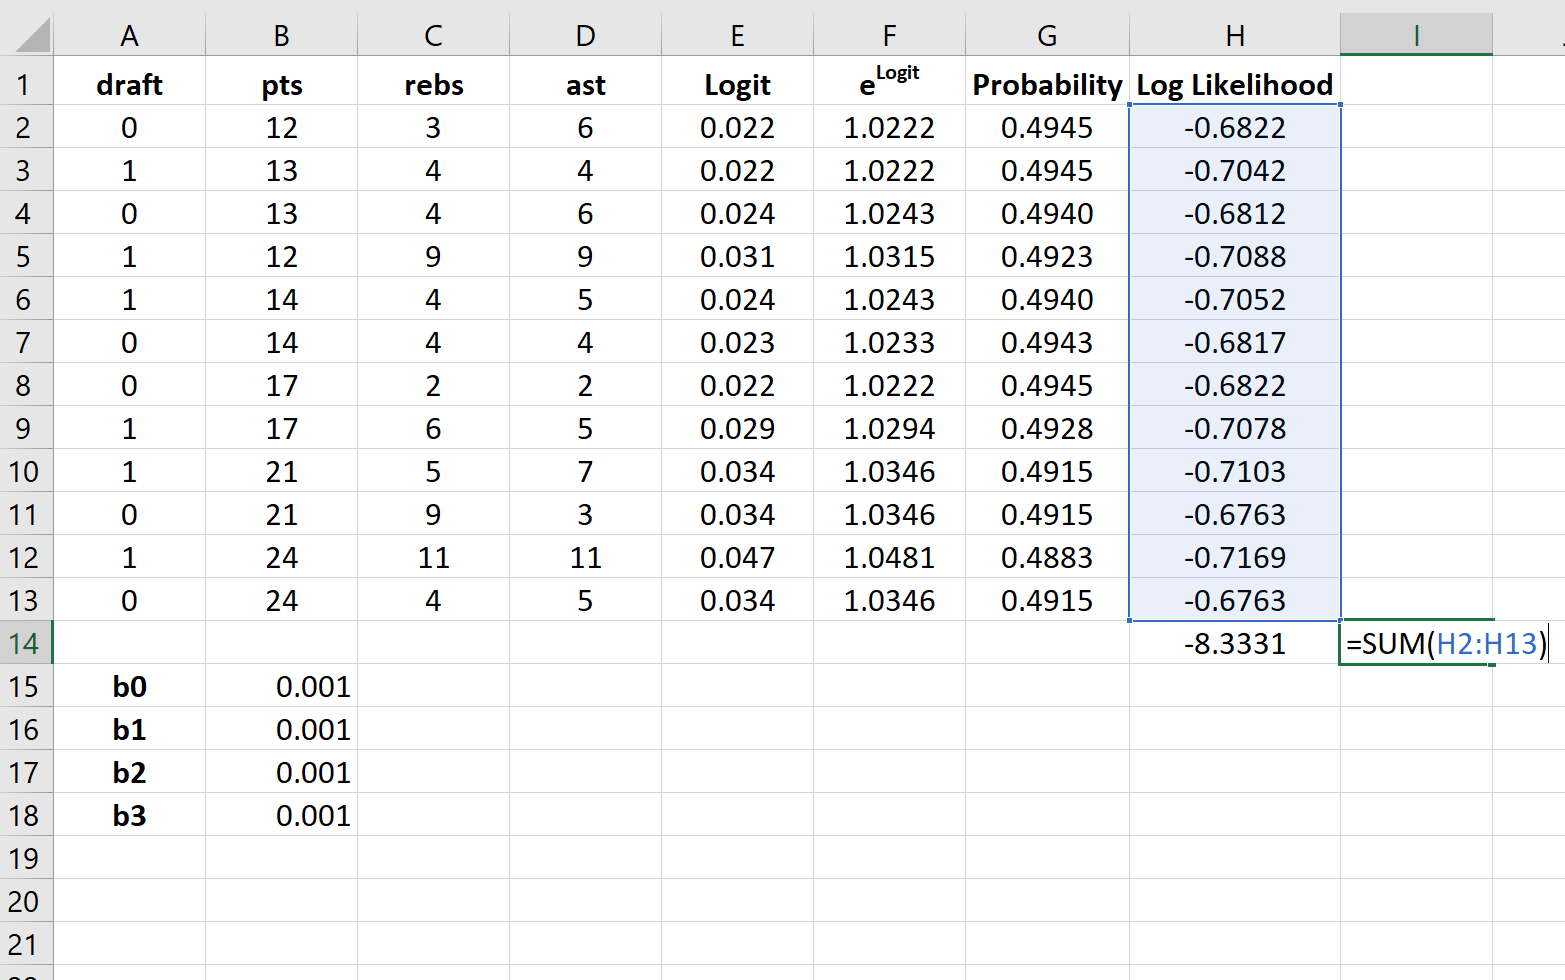
First, input the following data:
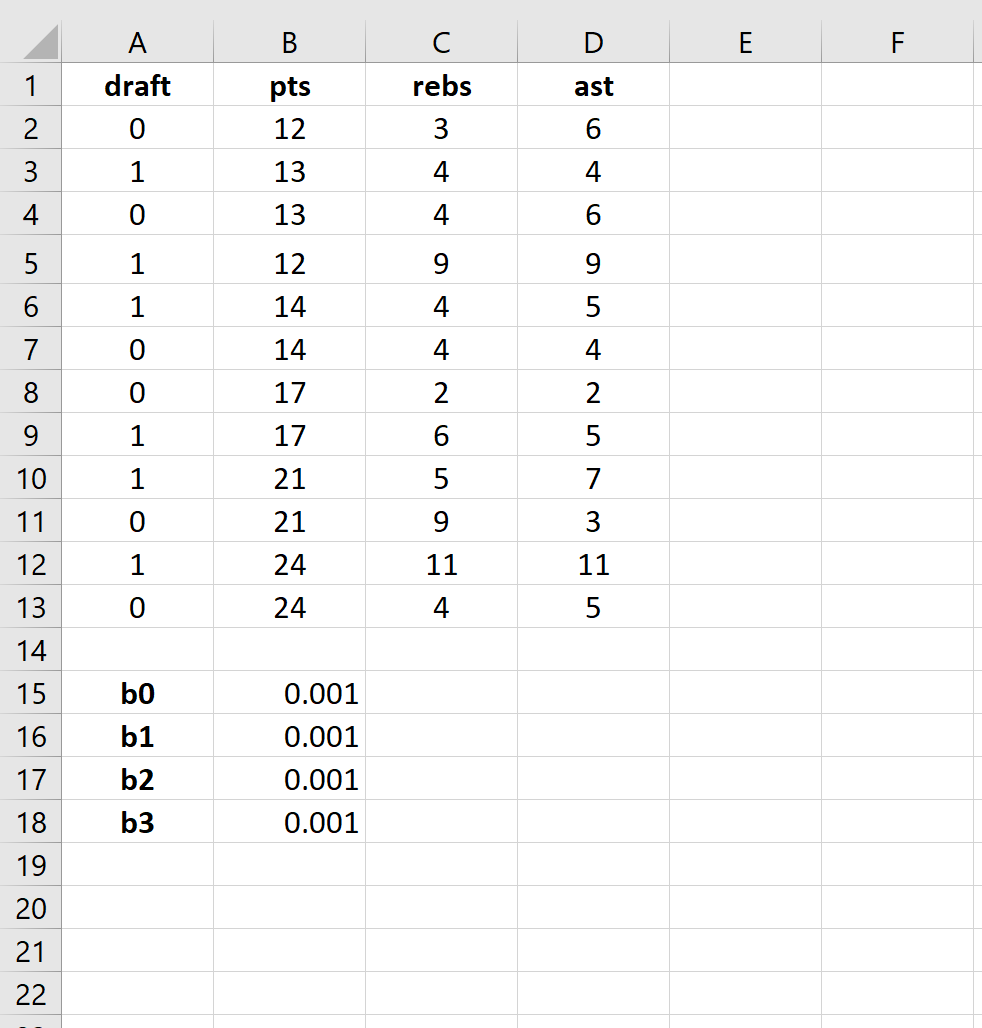
Step 2: Enter cells for regression coefficients.
Since we have three explanatory variables in the model (pts, rebs, ast), we will create cells for three regression coefficients plus one for the intercept in the model. We will set the values for each of these to 0.001, but we will optimize for them later.
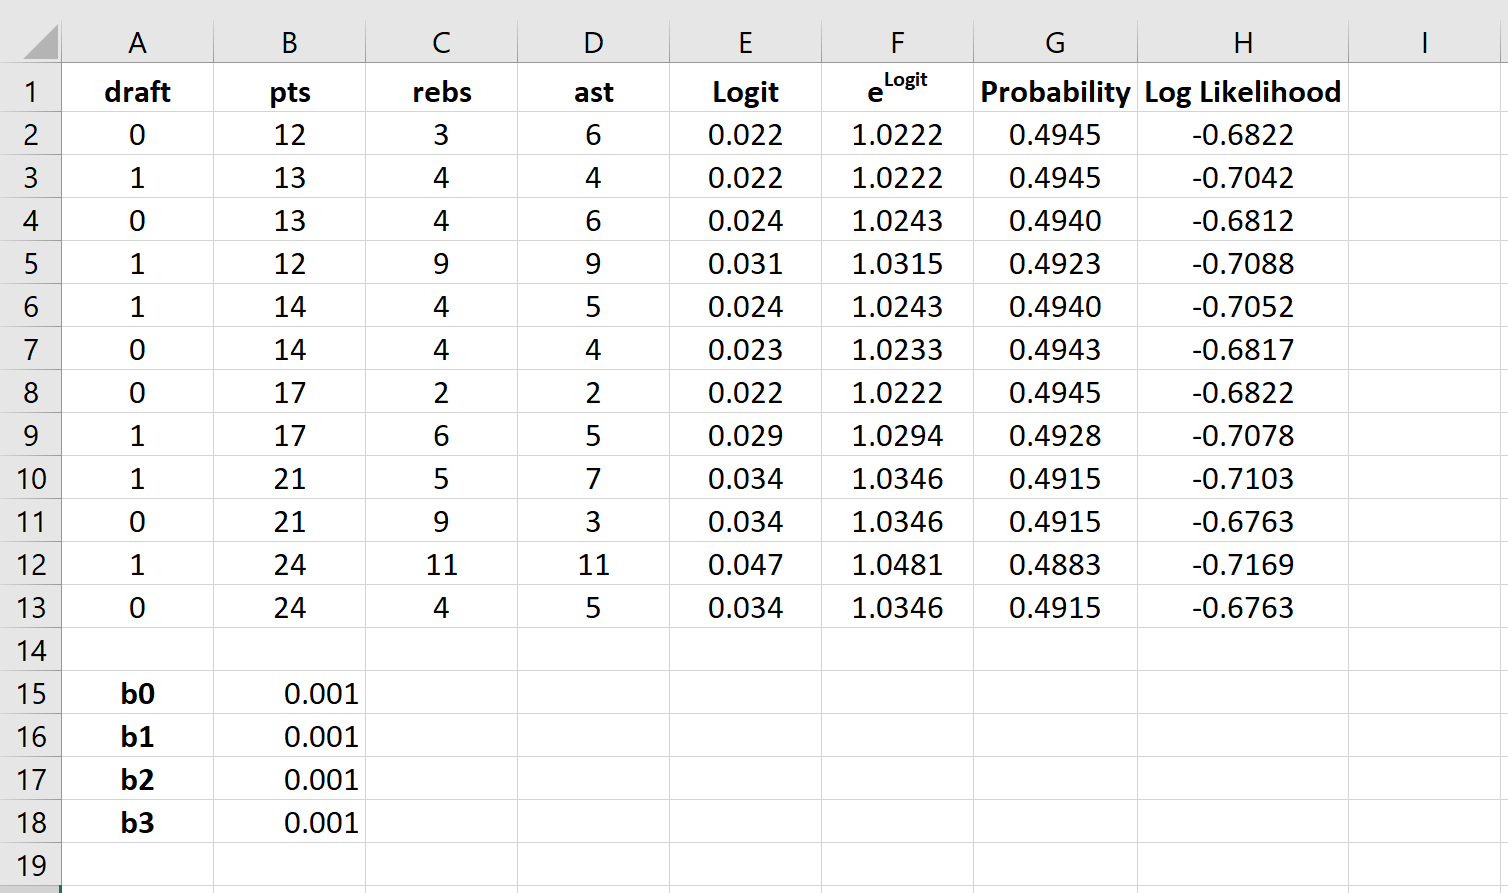
Next, we will have to create a few new columns that we will use to optimize for these regression coefficients including the logit, elogit, probability, and log likelihood.
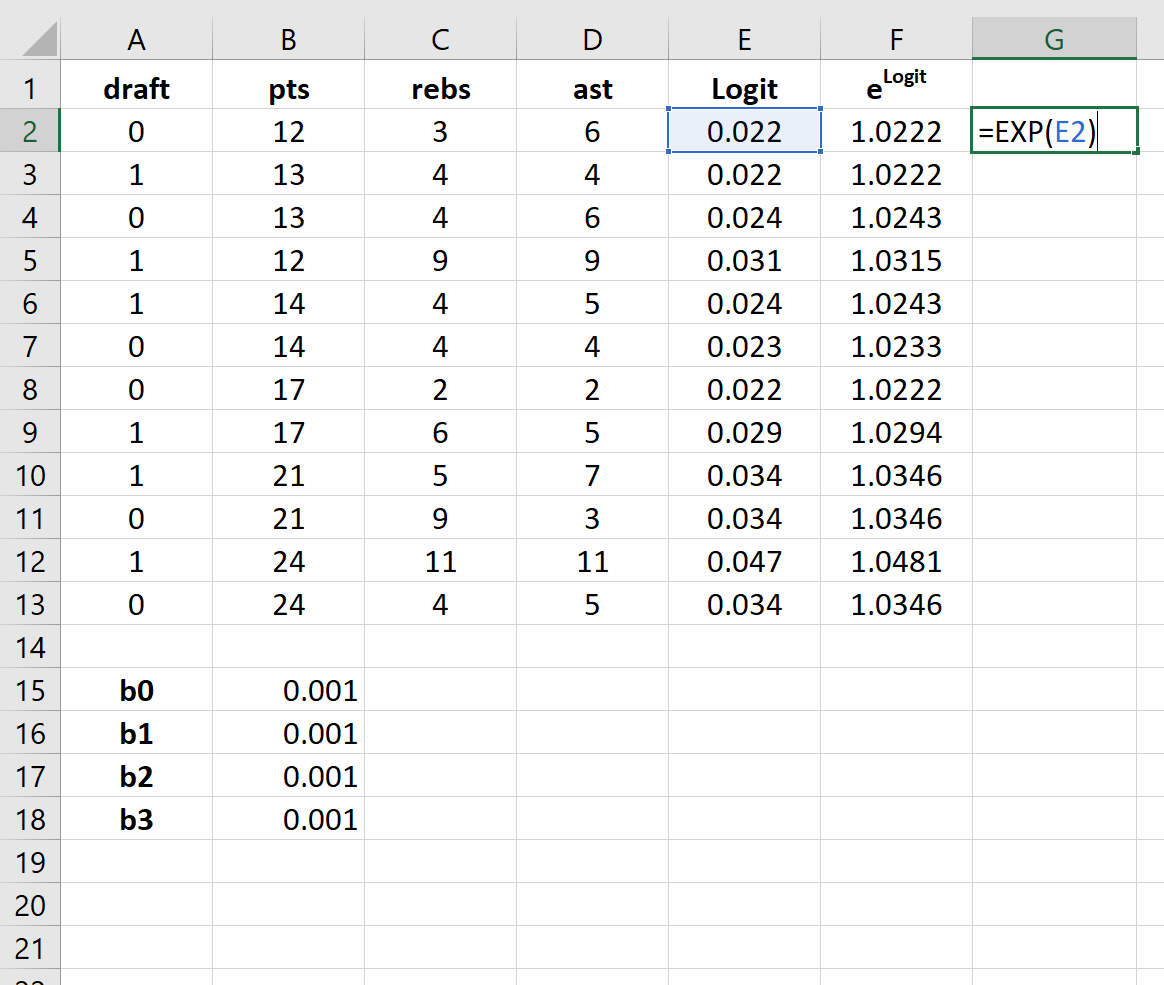
Step 3: Create values for the logit.
Next, we will create the logit column by using the the following formula:
Step 4: Create values for elogit.
Next, we will create values for elogit by using the following formula:
Step 5: Create values for probability.
Next, we will create values for probability by using the following formula:
Step 6: Create values for log likelihood.
Next, we will create values for log likelihood by using the following formula:
Log likelihood = LN(Probability)
Step 7: Find the sum of the log likelihoods.
Lastly, we will find the sum of the log likelihoods, which is the number we will attempt to maximize to solve for the regression coefficients.
Step 8: Use the Solver to solve for the regression coefficients.
If you haven’t already install the Solver in Excel, use the following steps to do so:
- Click File.
- Click Options.
- Click Add-Ins.
- Click Solver Add-In, then click Go.
- In the new window that pops up, check the box next to Solver Add-In, then click Go.
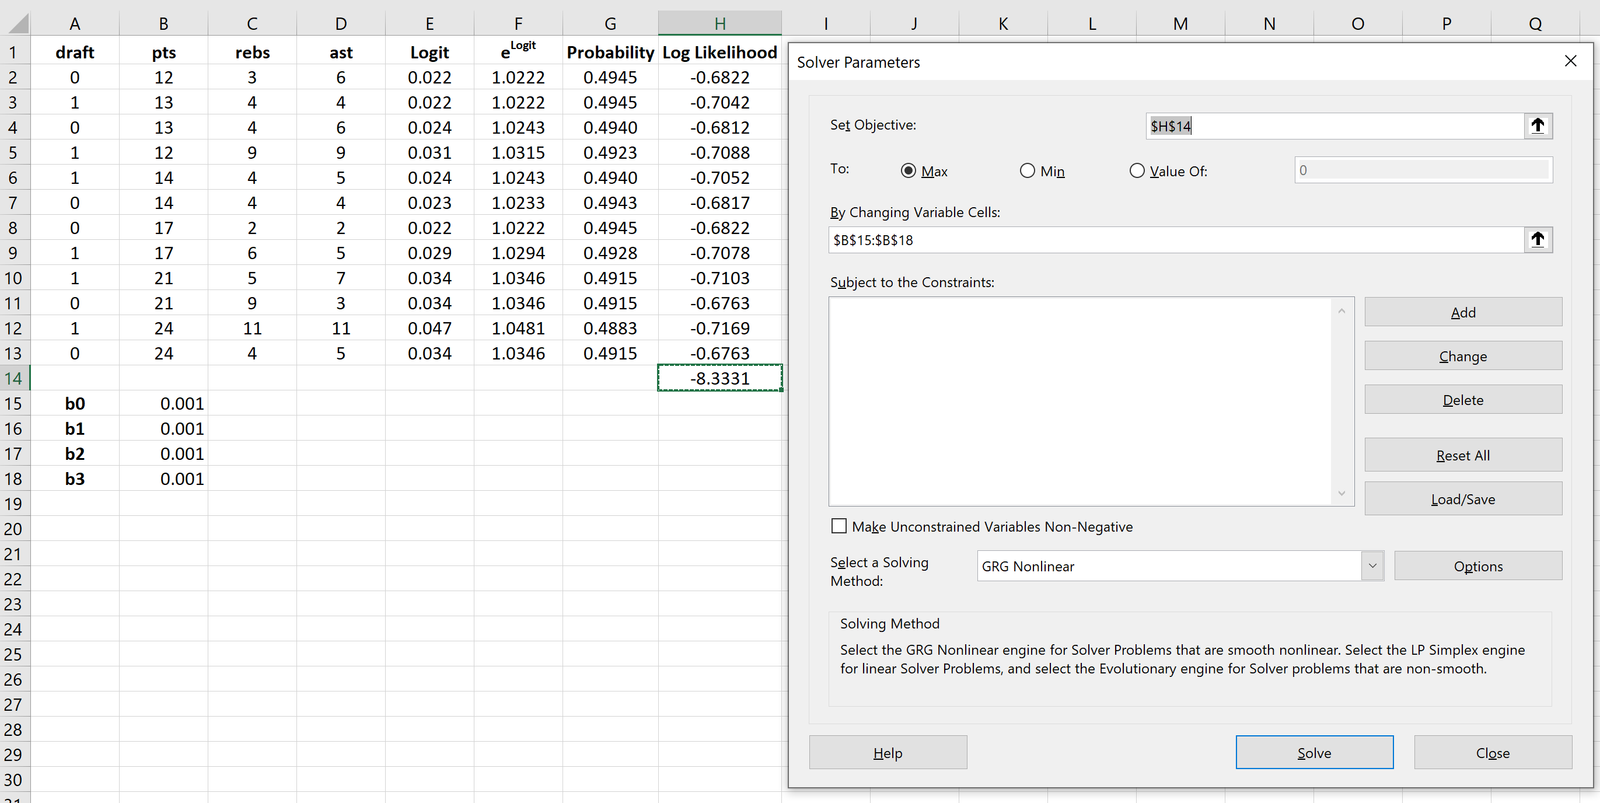
Once the Solver is installed, go to the Analysis group on the Data tab and click Solver. Enter the following information:
- Set Objective: Choose cell H14 that contains the sum of the log likelihoods.
- By Changing Variable Cells: Choose the cell range B15:B18 that contains the regression coefficients.
- Make Unconstrained Variables Non-Negative: Uncheck this box.
- Select a Solving Method: Choose GRG Nonlinear.
Then click Solve.
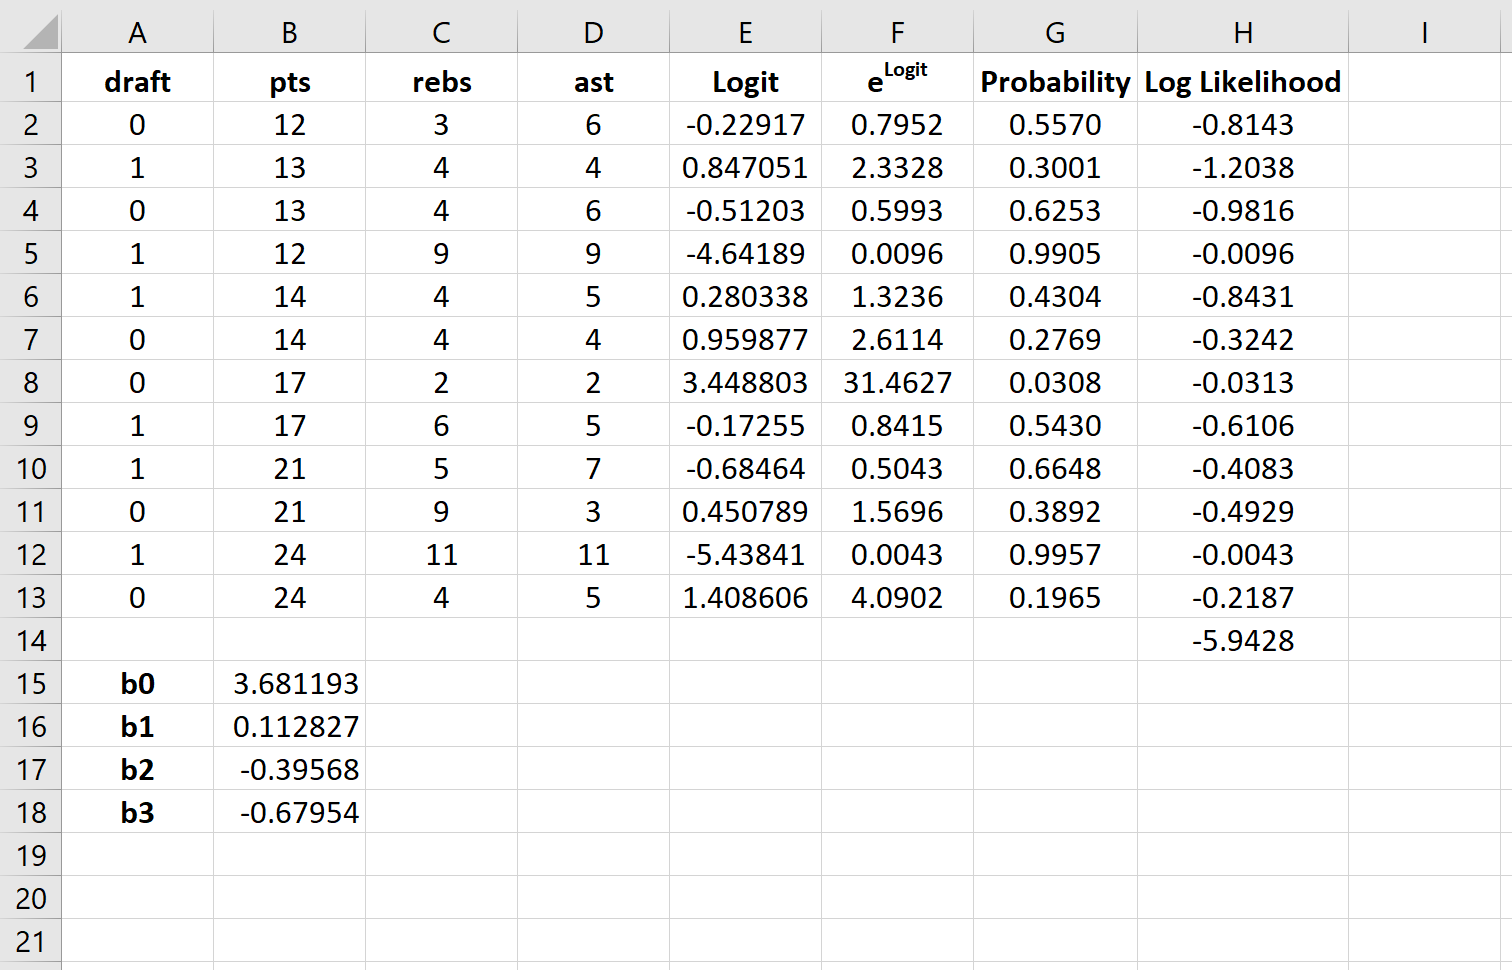
The Solver automatically calculates the regression coefficient estimates:
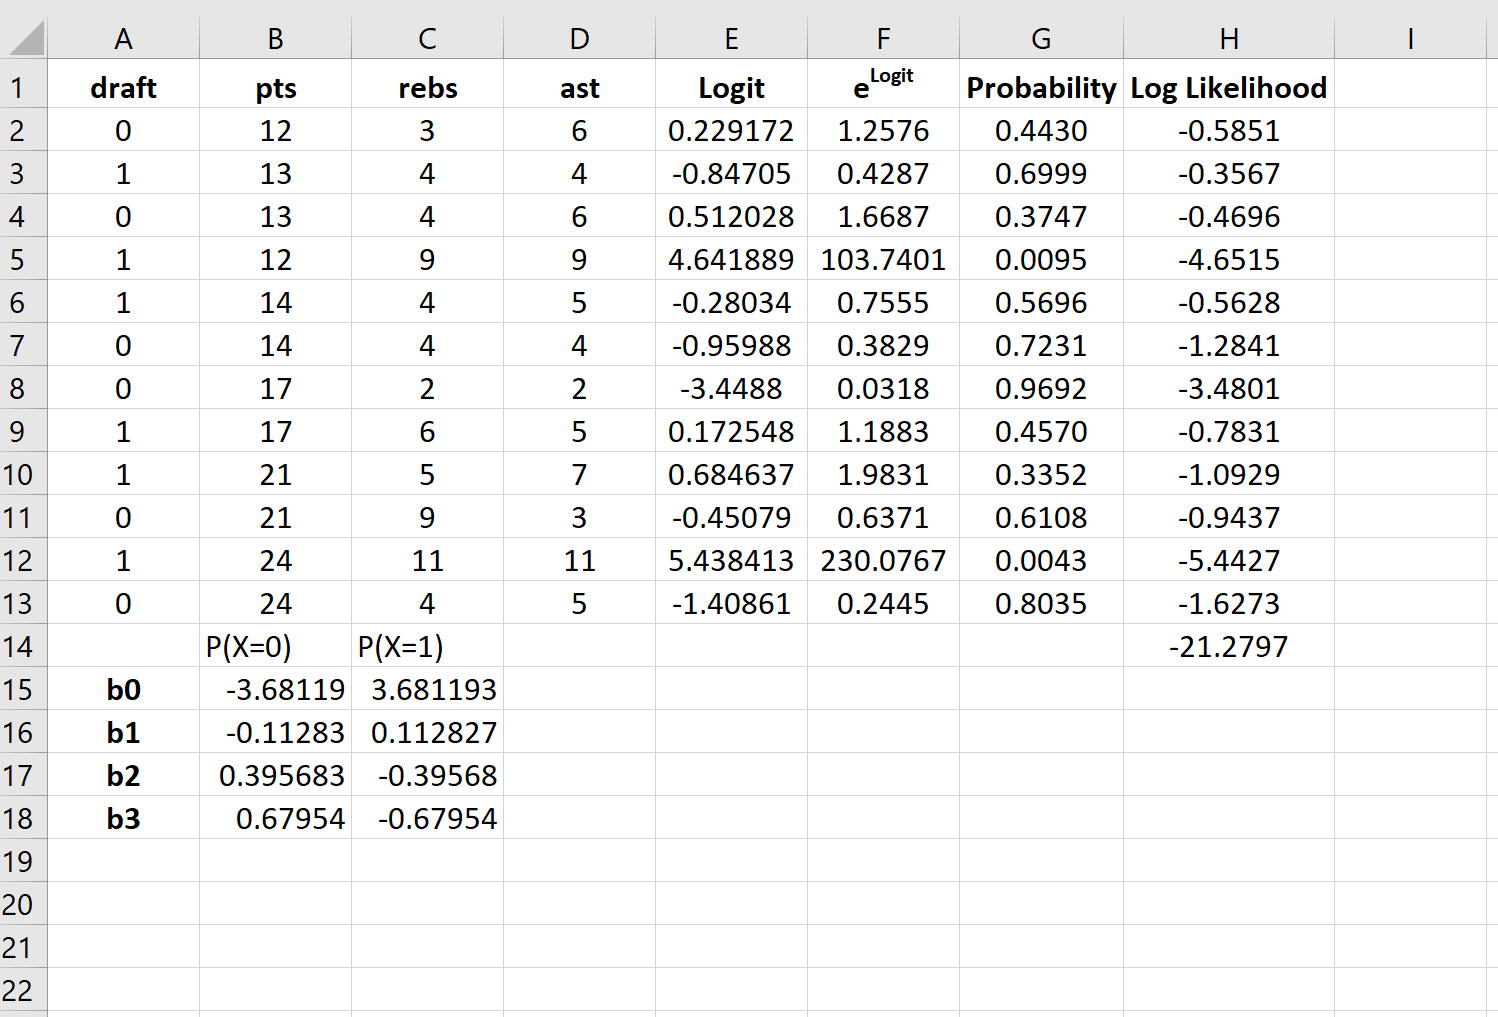
By default, the regression coefficients can be used to find the probability that draft = 0. However, typically in logistic regression we’re interested in the probability that the response variable = 1. So, we can simply reverse the signs on each of the regression coefficients:
Now these regression coefficients can be used to find the probability that draft = 1.
For example, suppose a player averages 14 points per game, 4 rebounds per game, and 5 assists per game. The probability that this player will get drafted into the NBA can be calculated as:
P(draft = 1) = e3.681193 + 0.112827*(14) -0.39568*(4) – 0.67954*(5) / (1+e3.681193 + 0.112827*(14) -0.39568*(4) – 0.67954*(5)) = 0.57.
Since this probability is greater than 0.5, we predict that this player would get drafted into the NBA.


