The easiest way to draw a legend outside of a plot in base R is to add extra space to the right of the plot by using the following syntax:
par(mar=c(5, 4, 4, 8), xpd=TRUE)
The following step-by-step example shows how to use this syntax in practice.
Step 1: Create the Data
First, let’s create some data to work with:
#create data frames
df1 frame(x=c(1, 2, 3, 4, 5, 6, 7),
                  y=c(2, 7, 19, 26, 24, 29, 31))

df2 frame(x=c(1, 2, 3, 4, 5, 6, 7),
                  y=c(4, 4, 7, 9, 12, 13, 8))
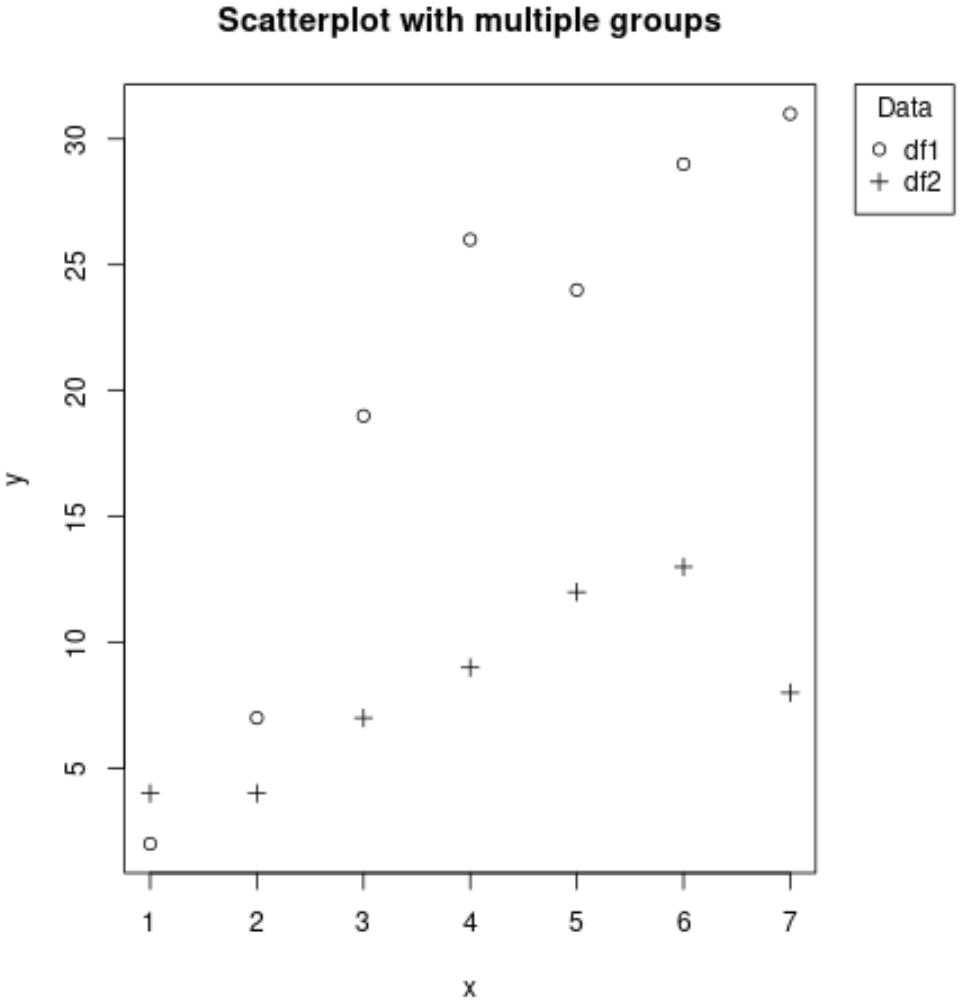
Step 2: Create a Plot with a Legend Outside of Plot
Next, let’s create a plot and add a legend outside of the plot in the top right corner:
#add extra space to the right of the plot
par(mar=c(5, 4, 4, 8), xpd=TRUE)

#plot both data frames
plot(y ~ x, df1, pch=1, main="Scatterplot with multiple groups")
points(y ~ x, df2, pch=3)

#add legend outside of plot
legend("topright", inset=c(-0.2, 0), legend=c("df1","df2"), pch=c(1,3), title="Data")
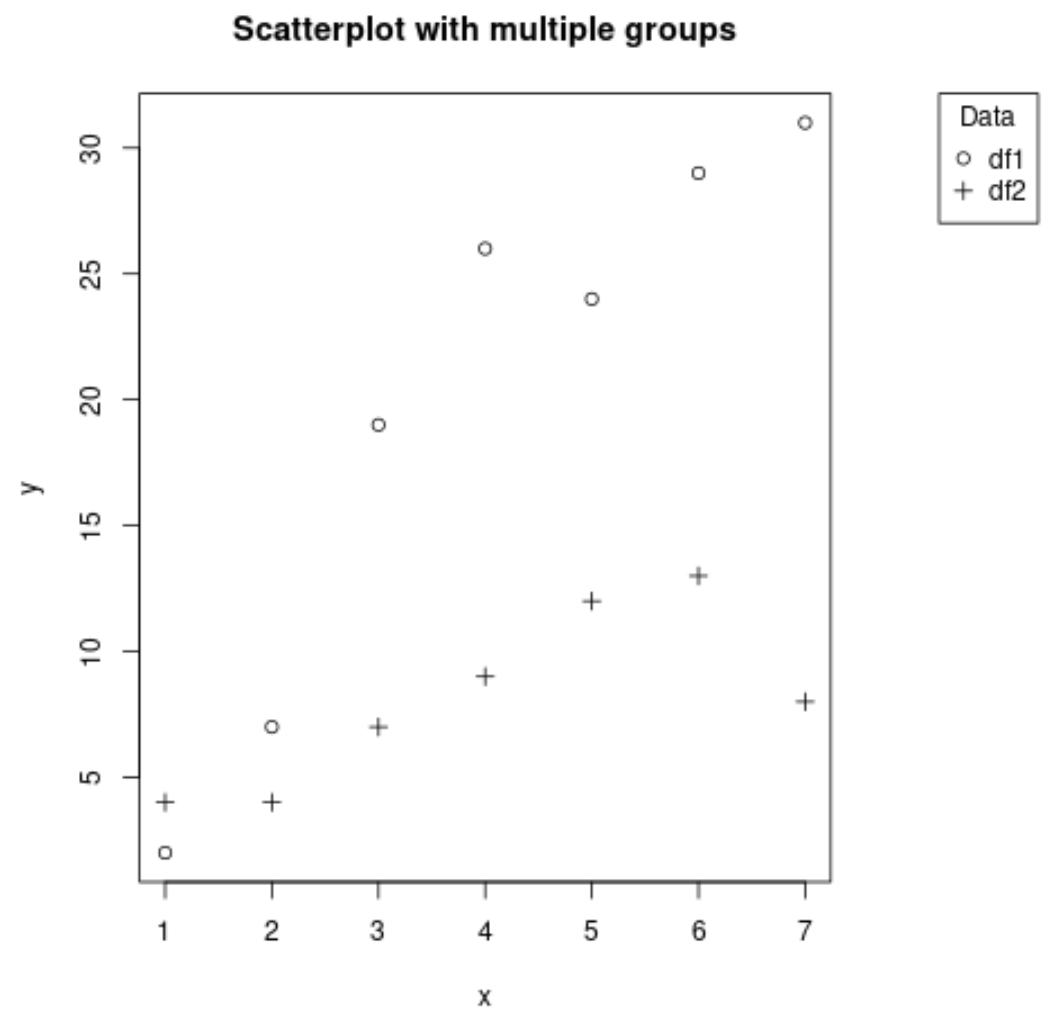
Step 3: Modify the Legend Location
The inset(x, y) argument can be used to control the location of the legend to the right of the plot. For example, we can make the x argument more negative to push the legend even further to the right:
#add extra space to the right of the plot
par(mar=c(5, 4, 4, 8), xpd=TRUE)

#plot both data frames
plot(y ~ x, df1, pch=1, main="Scatterplot with multiple groups")
points(y ~ x, df2, pch=3)

#add legend outside of plot
legend("topright", inset=c(-0.3, 0), legend=c("df1","df2"), pch=c(1,3), title="Data")
We can also make the y argument more positive to push the legend lower:
#add extra space to the right of the plot
par(mar=c(5, 4, 4, 8), xpd=TRUE)

#plot both data frames
plot(y ~ x, df1, pch=1, main="Scatterplot with multiple groups")
points(y ~ x, df2, pch=3)

#add legend outside of plot
legend("topright", inset=c(-0.3, .5), legend=c("df1","df2"), pch=c(1,3), title="Data")
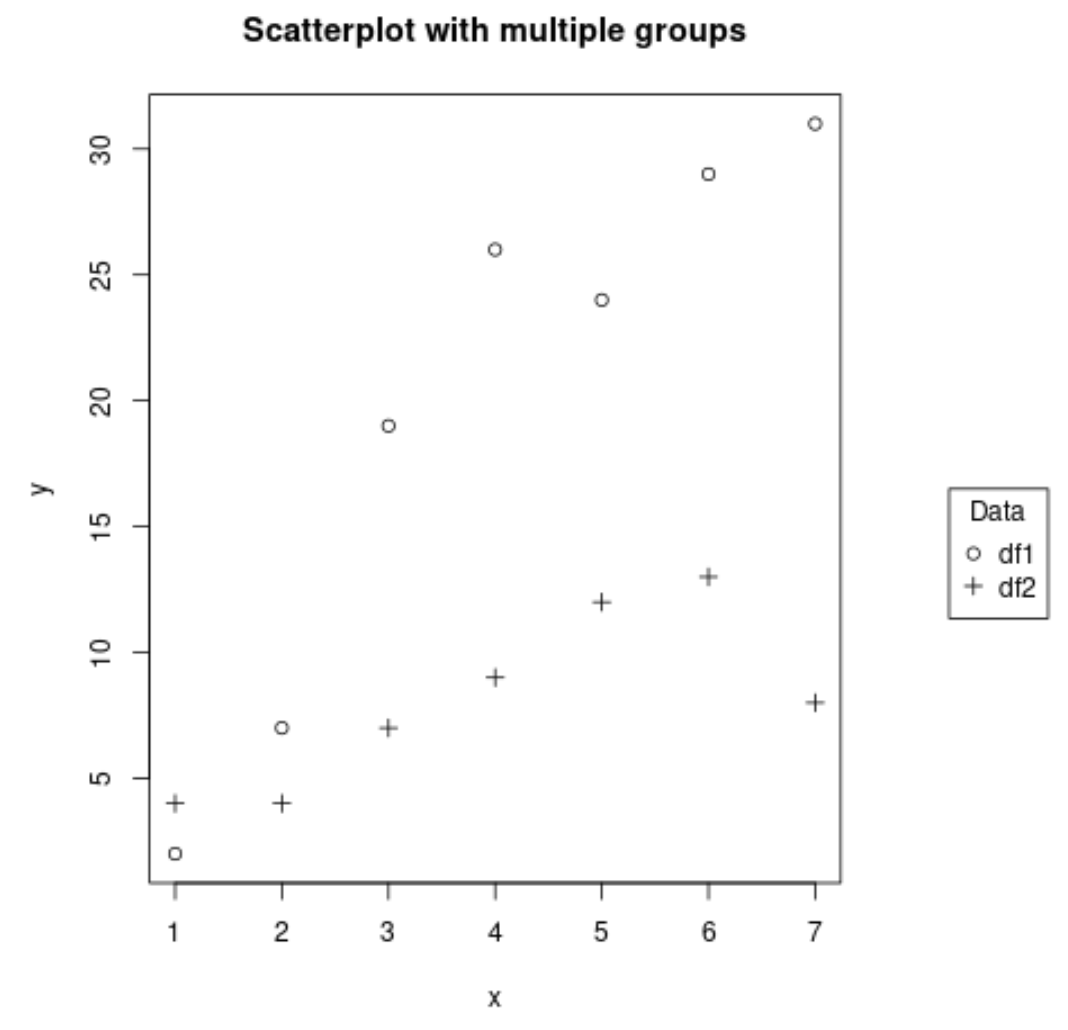
Feel free to modify the values in the inset(x, y) argument to modify the location of the legend.
You can find more R tutorials on this page.