A KPSS test can be used to determine if a time series is trend stationary.
This test uses the following null and alternative hypothesis:
- H0: The time series is trend stationary.
- HA: The time series is not trend stationary.
If the p-value of the test is less than some significance level (e.g. α = .05) then we reject the null hypothesis and conclude that the time series is not trend stationary.
Otherwise, we fail to reject the null hypothesis.
The following examples show how to perform a KPSS test in Python.
Example 1: KPSS Test in Python (With Stationary Data)
First, let’s create some fake data in Python to work with:
import numpy as np
import matplotlib.pyplot as plt
#make this example reproducible
np.random.seed(1)
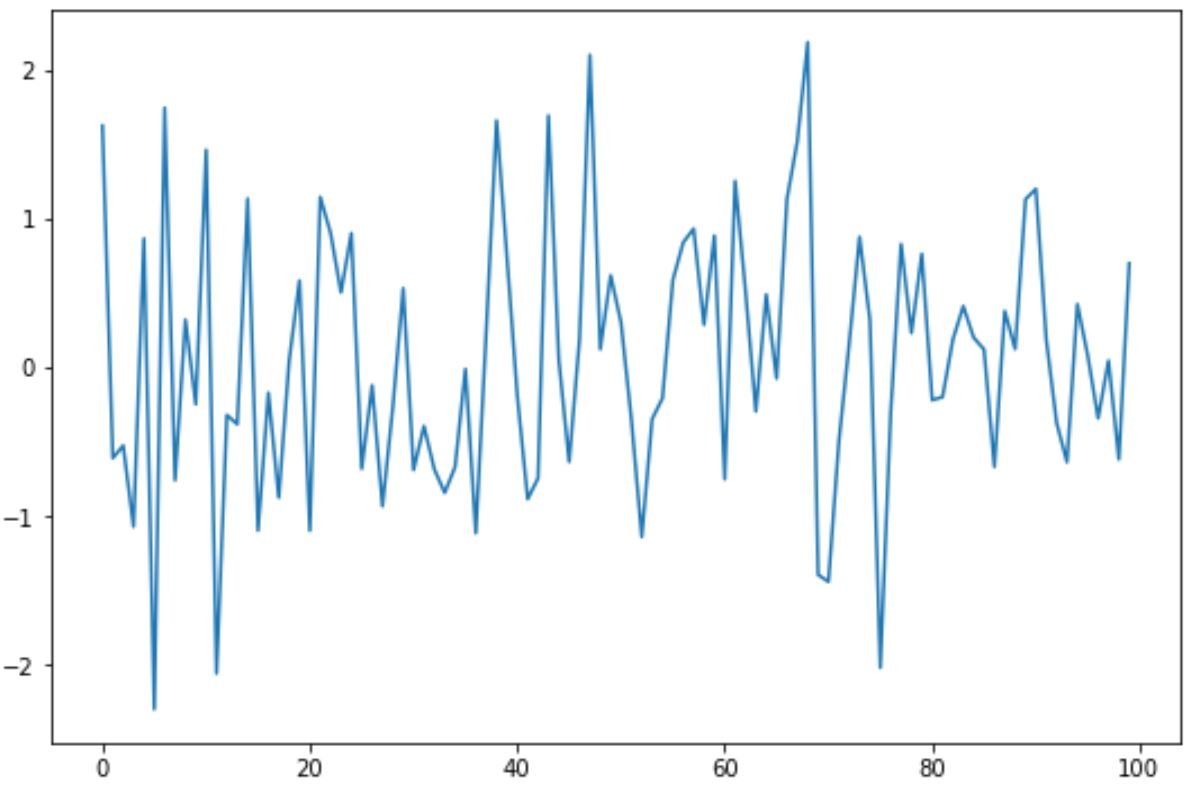
#create time series data
data = np.random.normal(size=100)
#create line plot of time series data
plt.plot(data)
We can use the kpss() function from the statsmodels package to perform a KPSS test on this time series data:
import statsmodels.api as sm

#perform KPSS test
sm.tsa.stattools.kpss(data, regression='ct')

(0.0477617848370993,
 0.1,
 1,
 {'10%': 0.119, '5%': 0.146, '2.5%': 0.176, '1%': 0.216})

InterpolationWarning: The test statistic is outside of the range of p-values available
in the look-up table. The actual p-value is greater than the p-value returned.
Here’s how to interpret the output:
- The KPSS test statistic: 0.04776
- The p-value: 0.1
- The truncation lag parameter: 1
- The critical values at 10%, 5%, 2.5%, and 1%
The p-value is 0.1. Since this value is not less than .05, we fail to reject the null hypothesis of the KPSS test.
This means we can assume that the time series is trend stationary.
Note 1: The p-value is actually even greater than 0.1, but the lowest value that the kpss() function will output is 0.1.
Note 2: We must use the argument regression=’ct’ to specify that the null hypothesis of the test is that the data is trend stationary.
Example 2: KPSS Test in Python (With Non-Stationary Data)
First, let’s create some fake data in Python to work with:
import numpy as np
import matplotlib.pyplot as plt
#make this example reproducible
np.random.seed(1)
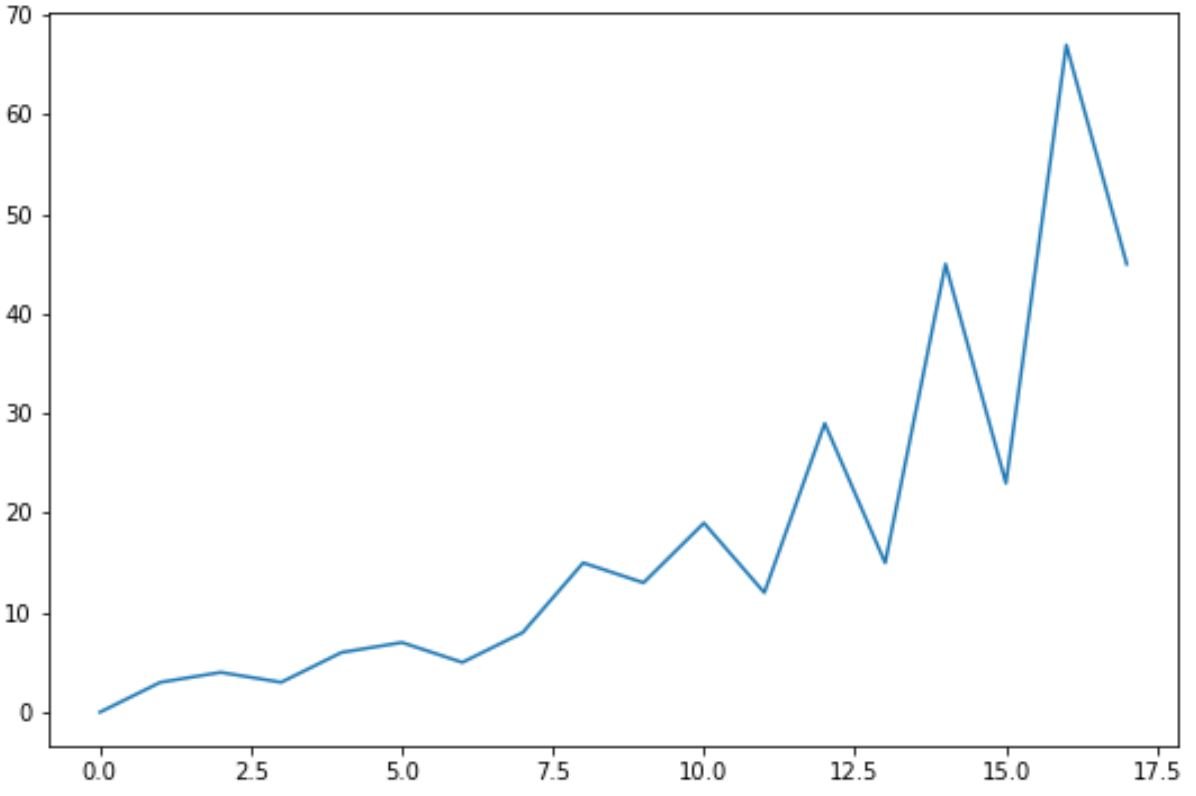
#create time series data
data =np.array([0, 3, 4, 3, 6, 7, 5, 8, 15, 13, 19, 12, 29, 15, 45, 23, 67, 45])
#create line plot of time series data
plt.plot(data)
Once again, we can use the kpss() function from the statsmodels package to perform a KPSS test on this time series data:
import statsmodels.api as sm

#perform KPSS test
sm.tsa.stattools.kpss(data, regression='ct')

(0.15096358910843685,
 0.04586367574296928,
 3,
 {'10%': 0.119, '5%': 0.146, '2.5%': 0.176, '1%': 0.216})
Here’s how to interpret the output:
- The KPSS test statistic: 0.1509
- The p-value: 0.0458
- The truncation lag parameter: 3
- The critical values at 10%, 5%, 2.5%, and 1%
The p-value is 0.0458. Since this value is less than .05, we reject the null hypothesis of the KPSS test.
This means the time series is not trend stationary.
Note: You can find the complete documentation for the kpss() function from the statsmodels package here.
Additional Resources
The following tutorials provide additional information on how to work with time series data in Python:
How to Perform an Augmented Dickey-Fuller Test in Python
How to Perform a Mann-Kendall Trend Test in Python
How to Plot a Time Series in Matplotlib