The interquartile range, often denoted IQR, is a way to measure the spread of the middle 50% of a dataset. It is calculated as the difference between the first quartile (Q1) and the third quartile (Q3) of a dataset.
Note that quartiles are simply values that split up a dataset into four equal parts.
The IQR is often used to measure the spread of values in a dataset because it’s known to be resistant to outliers. Since it only tells us the spread of the middle 50% of the dataset, it isn’t affect by unusually small or unusually large outliers.
This makes it a preferable way to measure dispersion compared to a metric like the range, which simply tells us the difference between the largest and the smallest values in a dataset.
This tutorial explains how to calculate the IQR for a given dataset in Google Sheets.
Example: How to Calculate IQR in Google Sheets
Use the following steps to calculate the interquartile range (IQR) of a dataset in Google Sheets.
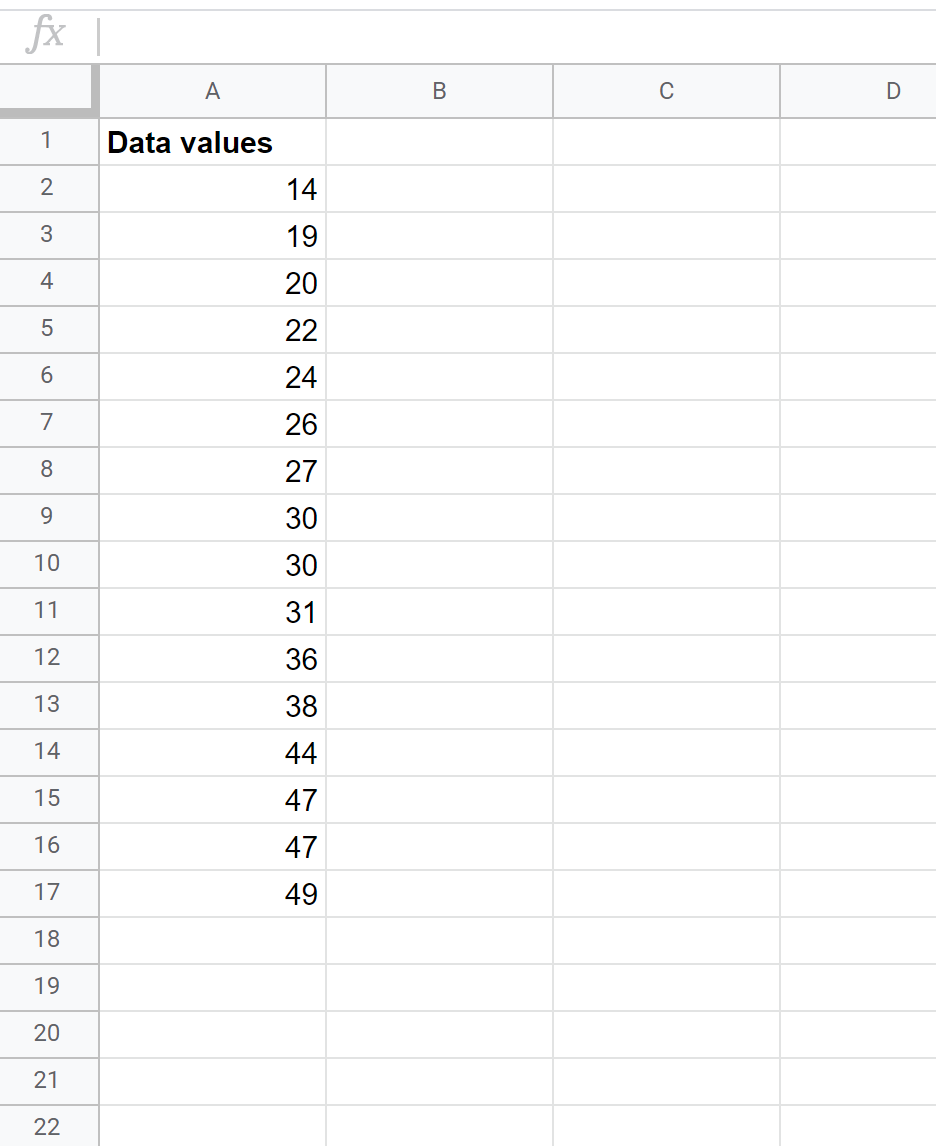
Step 1: Enter the data.
First, enter all of the values of a dataset into one column:
Step 2: Calculate the first and third quartiles.
Next, we’ll use the QUARTILE() function to calculate the first (Q1) and third (Q3) quartiles of the dataset.
Note that this function uses the following syntax:
QUARTILE(data, quartile_number)
where:
- data: An array of data values
- quartile_number: The quartile to calculate
The following image shows the formulas to use to calculate Q1 and Q3 for this dataset:
Step 3: Calculate the IQR.
Lastly, we can subtract the first quartile (Q1) from the third quartile (Q3) to obtain the interquartile range:
The interquartile range turns out to be 16. This tells us the spread of the middle 50% of values in our dataset.
Additional Resources
How to Calculate the Interquartile Range (IQR) in Excel
How to Calculate Standard Deviation in Google Sheets
How to Calculate a Five Number Summary in Google Sheets
How to Make a Box Plot in Google Sheets


