In statistics, an odds ratio tells us the ratio of the odds of an event occurring in a treatment group compared to the odds of an event occurring in a control group.
Odds ratios appear most often in logistic regression, which is a method we use to fit a regression model that has one or more predictor variables and a binary response variable.
One question students often have regarding odds ratios in logistic regression models is: How do I interpret an odds ratio less than 1?
Here’s how:
If a predictor variable in a logistic regression model has an odds ratio less than 1, it means that a one unit increase in that variable is associated with a decrease in the odds of the response variable occurring.
The following two examples show how to interpret an odds ratio less than 1 for both a continuous variable and a categorical variable.
Example 1: Interpreting Odds Ratios for Continuous Variables
Suppose we want to understand the relationship between a mother’s age and the probability of having a baby with a healthy birthweight.
To explore this, we can perform logistic regression using age as a predictor variable and healthy birthweight (no = 0, yes =1) as a response variable.
Suppose we collect data for 200 mothers and fit a logistic regression model. Here are the results:
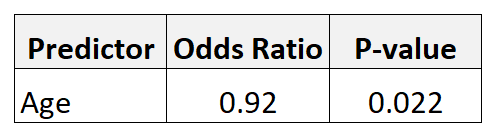
The odds ratio for the predictor variable age is less than 1. This means that each additional increase of one year in age is associated with a decrease in the odds of a mother having a healthy baby.
In particular, we can use the following formula to quantify the change in the odds:
Change in Odds %: (OR-1) * 100
For example, the odds ratio (OR) for age is 0.92. Thus, we could calculate:
Change in Odds %: (0.92 – 1) * 100 = -8%
This means that each additional increase of one year in age is associated with an 8% decrease in the odds of a mother having a healthy baby.
Example 2: Interpreting Odds Ratios for Categorical Variables
Suppose we want to understand the relationship between a mother’s smoking habits and the probability of having a baby with a healthy birthweight.
To explore this, we can perform logistic regression using smoking as a predictor variable (no = 0, yes = 1) and healthy birthweight (no = 0, yes =1) as a response variable.
Suppose we collect data for 200 mothers and fit a logistic regression model. Here are the results:

The odds ratio for the predictor variable smoking is less than 1. This means that increasing from 0 to 1 for smoking (i.e. going from a non-smoker to a smoker) is associated with a decrease in the odds of a mother having a healthy baby.
Once again, we can use the following formula to quantify the change in the odds:
Change in Odds %: (OR-1) * 100
For example, the odds ratio (OR) for smoking is 0.85. Thus, we could calculate:
Change in Odds %: (0.85 – 1) * 100 = -15%
This means that a mother who smokes experiences a reduction of 15% in the odds of having a healthy baby compared to a mother that does not smoke.
Additional Resources
Introduction to Logistic Regression
How to Calculate Odds Ratio and Relative Risk in Excel
What is an Adjusted Odds Ratio? (Definition + Examples)