The field of statistics is concerned with collecting, analyzing, interpreting, and presenting data.
In an education setting, statistics is important for the following reasons:
Reason 1: Statistics allows educators to understand student performance using descriptive statistics.
Reason 2: Statistics allows educators to spot trends in student performance using data visualizations.
Reason 3: Statistics allows educators to compare different teaching methods using hypothesis tests.
In the rest of this article, we elaborate on each of these reasons.
Reason 1: Understand Student Performance Using Descriptive Statistics
Descriptive statistics are used to describe data.
In an education setting, a teacher might calculate the following descriptive statistics for students in her class:
- The mean score on a certain exam.
- The standard deviation of scores on a certain exam.
- The range of scores on a certain exam.
- The percentage of students who passed a certain exam.
- The 90th percentile of scores on a certain exam.
Using these metrics, the teacher can gain a better understanding of how the students in her class performed on a certain exam.
She can then decide if she needs to change her teaching method if too few students pass the exam or perhaps offer additional tutoring opportunities for students who score low on the exam, etc.
Note: These types of descriptive statistics are used at every level of education. For example, a principal can use descriptive statistics to monitor exam scores of students in an entire school. Or a state department of education can use descriptive statistics to monitor exam scores for students in an entire state.
Reason 2: Spot Trends Using Data Visualization
Another common way that statistics is used in education is through data visualizations such as line charts, histograms, boxplots, pie charts and other charts.
These types of charts are often used to help educators spot trends in both class performance and individual student performance.
For example, suppose a teacher creates the following bar chart to visualize the average score on exams throughout the year:
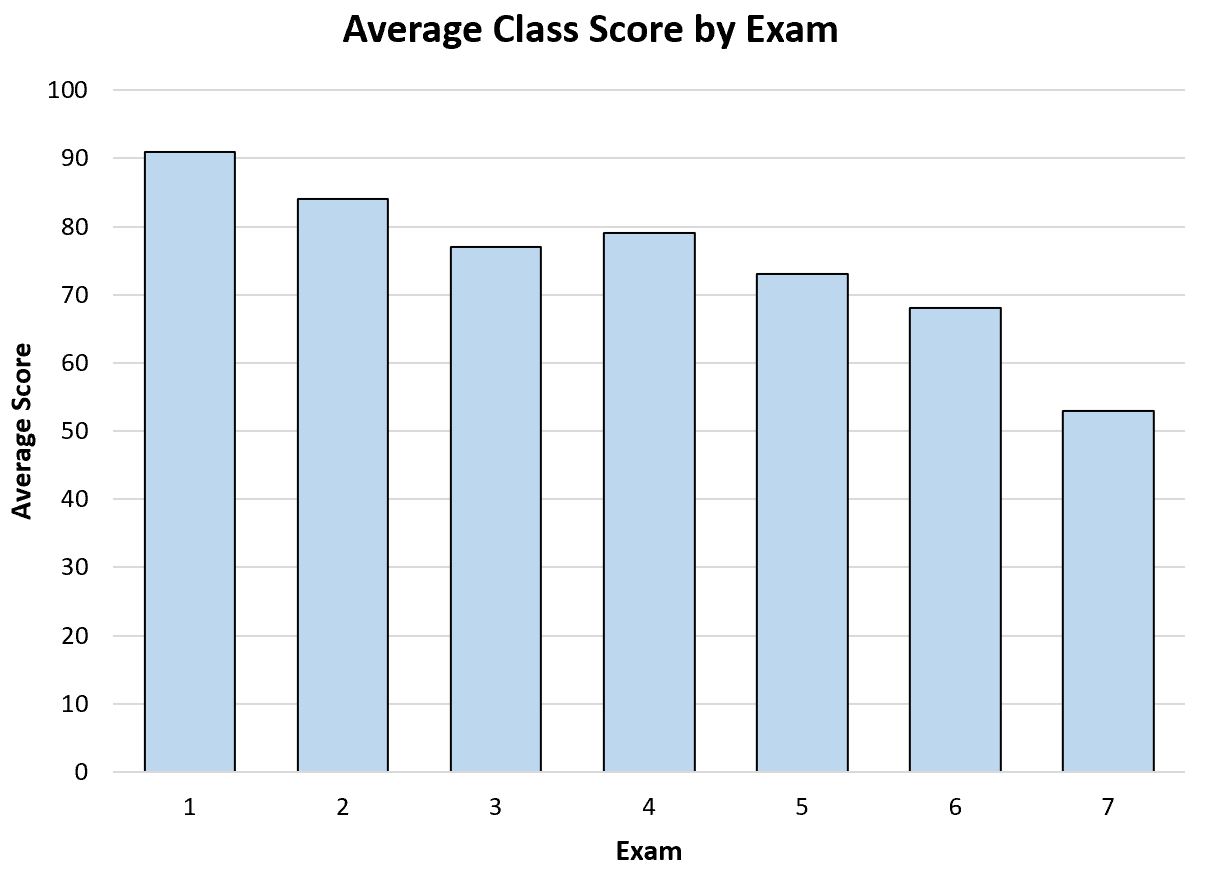
Just from looking at this bar chart, the teacher will be able to tell that the average exam score of students in her class is slowly decreasing as the year goes on.
This can allow the teacher to make an improvement in her teaching methods or perhaps administer a survey to her students to ask for their feedback on her teaching methods, etc.
Reason 3: Compare Teaching Methods Using Hypothesis Tests
Another way that statistics is used in education is in the form of hypothesis tests.
These are tests that educators can use to determine if there is a statistical significance between different teaching methods.
For example, suppose a teacher wants to determine if a certain study program affects test scores. To test this, he randomly selects 15 students to take a pre-test. Then, he has each student use the study program for one month and then a post-test of similar difficulty.
The test scores for each of the 15 students are shown below:
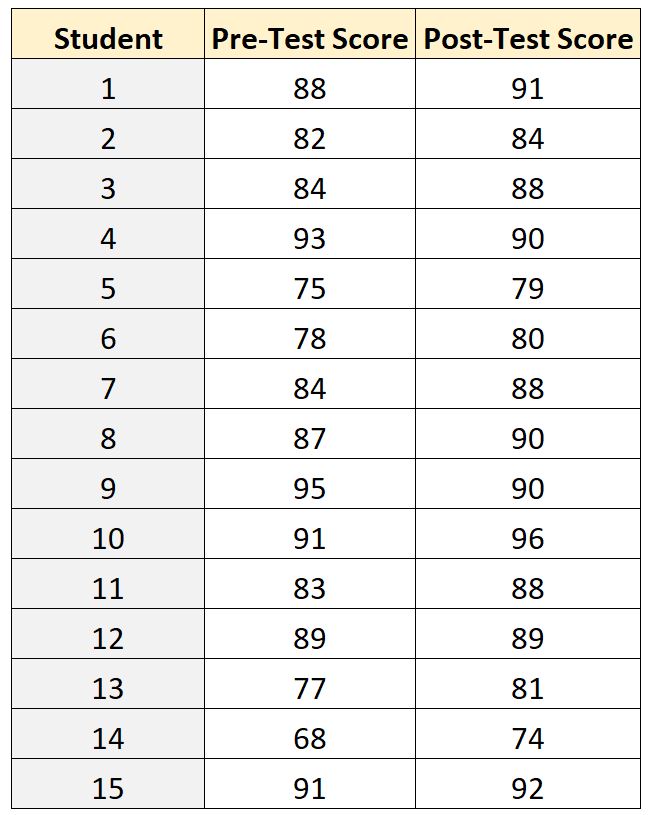
To compare the difference between the mean scores on the pre-test and post-test, the teacher can use a paired samples t-test because for each student their pre-test score can be paired with their post-test score.
Suppose the professor uses statistical software to perform this paired samples t-test and receives the following results:
- t test statistic: -2.97
- p-value: .0101
In this example, the paired samples t-test uses the following null and alternative hypotheses:
- H0: The mean pre-test and post-test scores are equal
- HA: The mean pre-test and post-test scores are not equal
Since the p-value (0.0101) is less than 0.05, we reject the null hypothesis.
This means we have sufficient evidence to say that the mean test score is different for students before and after participating in the study program.
Note: This is just one example of a hypothesis test that is used in education. Other common tests include a one sample t-test, two sample t-test, one-way ANOVA, and two-way ANOVA.
Additional Resources
The following articles explain the importance of statistics in other fields:
The Importance of Statistics in Business
The Importance of Statistics in Economics
The Importance of Statistics in Healthcare