The field of statistics is concerned with collecting, analyzing, interpreting, and presenting data.
In the field of economics, statistics is important for the following reasons:
Reason 1: Statistics allows economists to understand the state of the economy using descriptive statistics.
Reason 2: Statistics allows economists to spot trends in the economy using data visualizations.
Reason 3: Statistics allows economists to quantify the relationship between variables using regression models.
Reason 4: Statistics allows economists to forecast trends in the economy.
In the rest of this article, we elaborate on each of these reasons.
Reason 1: Understand the Economy Using Descriptive Statistics
Descriptive statistics are used to describe data.
Economists often calculate the following descriptive statistics for a given region:
- The mean household income.
- The standard deviation of household incomes.
- The sum of gross domestic product.
- The percentage change in total new jobs.
Using these metrics, economists can gain a better understanding of the state of the economy in a particular region.
They can then use these metrics to inform politicians or law makers on the best methods to use to ensure that the economy remains healthy and grows.
Note: These types of descriptive statistics are used at every level of economics. For example, economists at the national level, state level, city level, county level, etc. all use descriptive statistics to gain a better understanding of the state of the economy in their area.
Reason 2: Spot Trends Using Data Visualization
Another common way that statistics is used in economics is through data visualizations such as line charts, histograms, boxplots, pie charts and other charts.
These types of charts are often used to help economists spot trends that can help them see if the economy is improving or declining.
For example, suppose an economist creates the following line chart that shows the overall unemployment rate in a certain city by year:
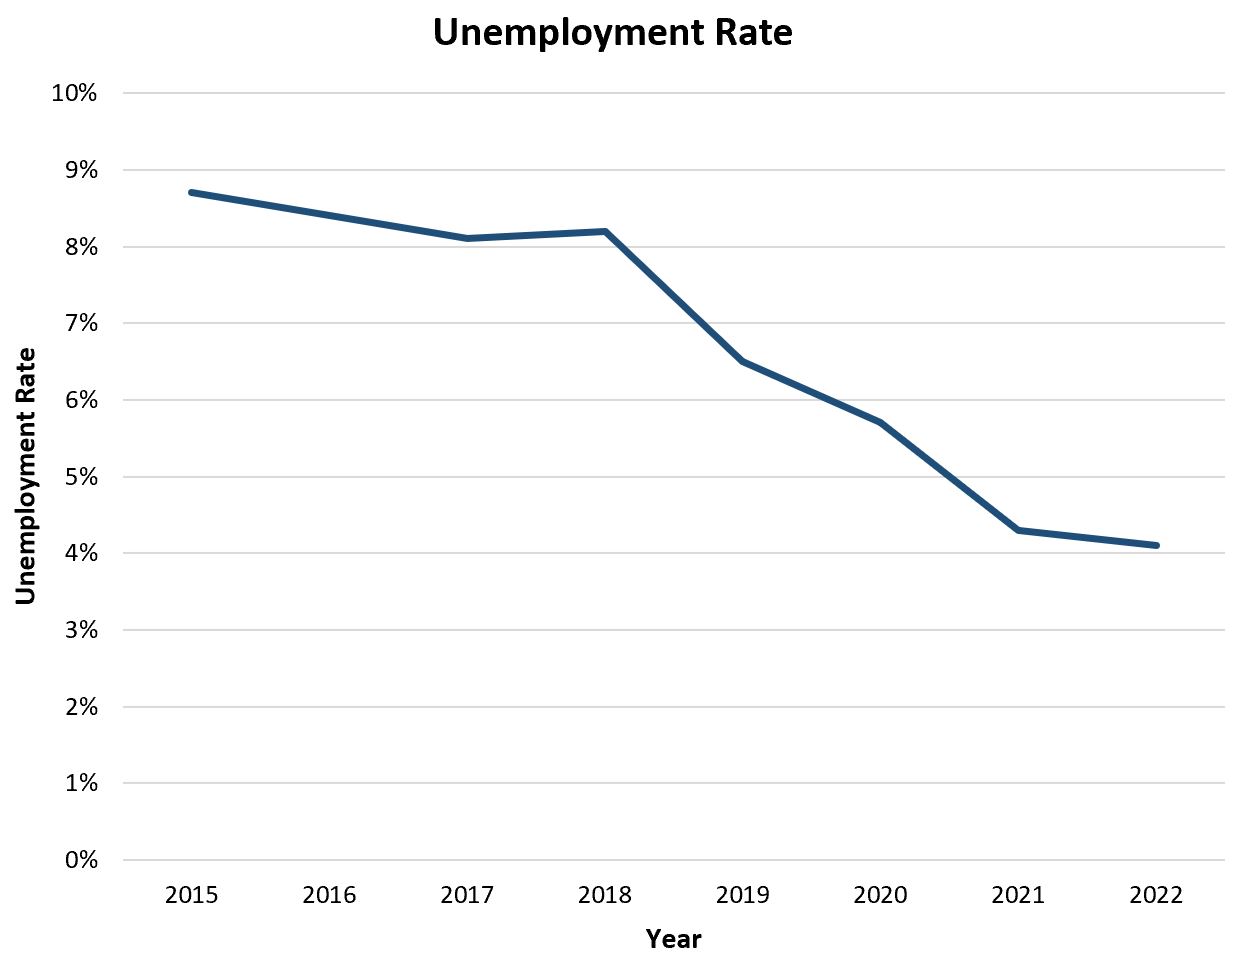
Just from looking at this bar chart, the economist will be able to tell that the unemployment rate is decreasing over time, which is a sign that the economy is strong and more citizens are becoming employed.
Reason 3: Quantify Relationship Between Variables Using Regression Models
Another way that statistics is used in economics is in the form of regression models.
These are models that allow economists to quantify the relationship between one or more predictor variables and a response variable.
For example, an economist may have access to data on total years of education, hours spent working per week, and household income for households in a certain city.
They might then build the following multiple linear regression model:
Income = 35,870.22 + 1,500.24(years of education) + 400.34(hours spent working per week)
Here’s how to interpret the regression coefficients in this model:
- For each additional year of education, total household income increases by an average of $1,500.24 (assuming hours spent working is held constant).
- For each additional hour spent working per week, total household income increases by an average of $400.34 (assuming years of education is held constant).
Using this model, the economist can quickly understand that increasing education and total hours worked is associated with a higher household income.
They can also quantify exactly how much additional education and additional working hours affects household income.
Reason 4: Forecast Trends in the Economy
Another way that statistics is used in economics is in the form of forecasting trends.
For example, an economist may collect data on total sales (in millions) of goods in a certain country and then create a forecast for future sales:
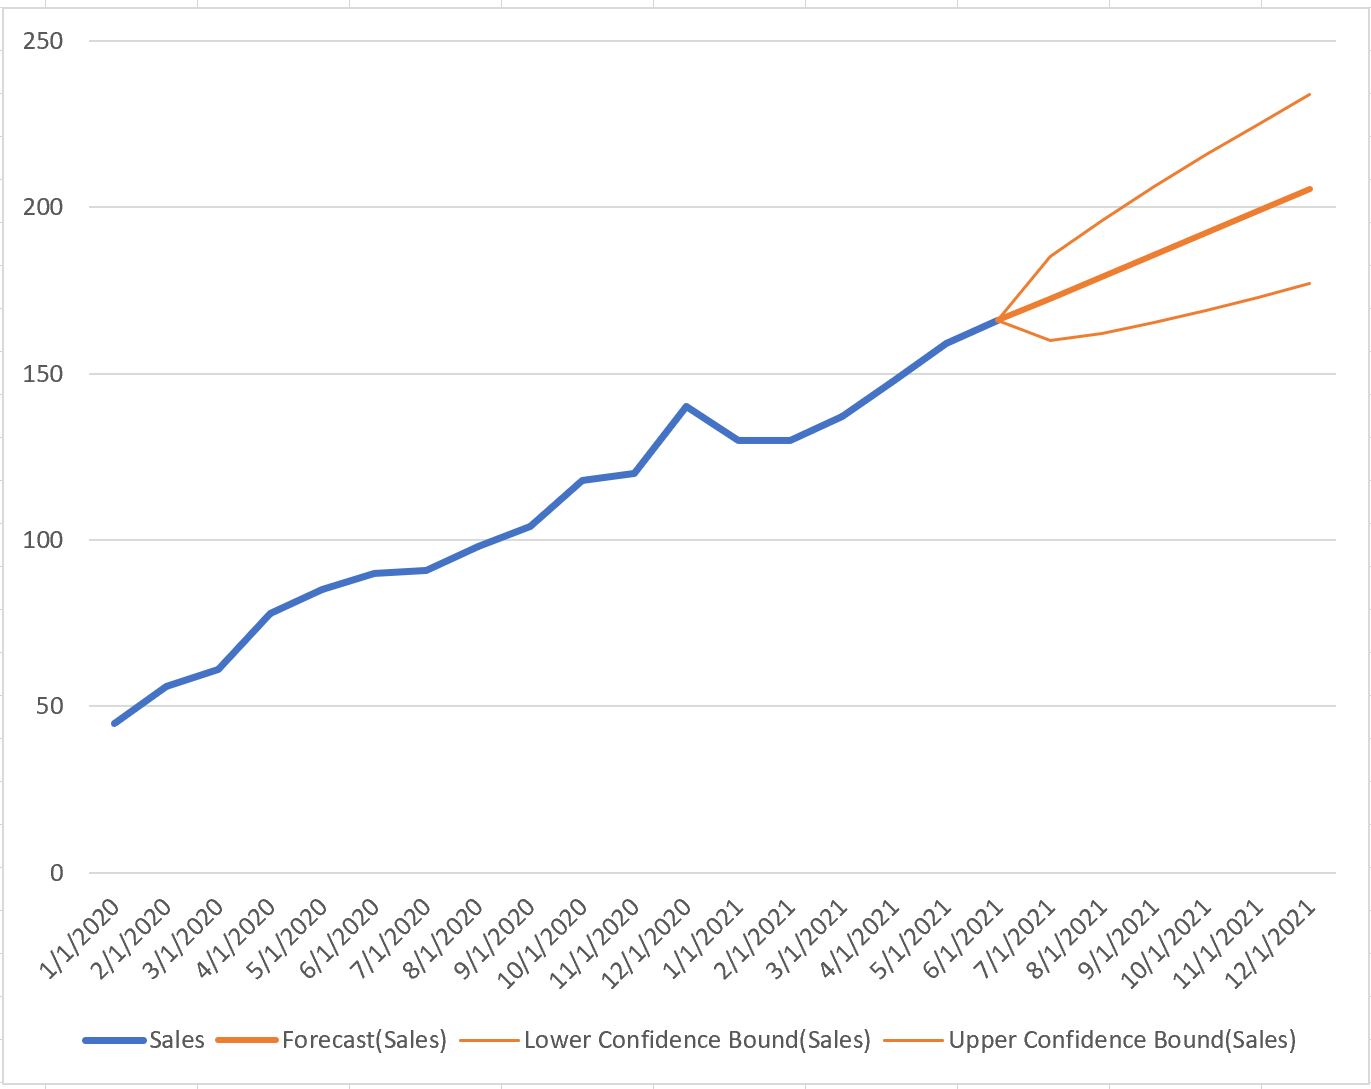
Using this forecast, the economist can predict (with a certain level of confidence) how the economy is likely to perform in the coming months and years.
Additional Resources
The following articles explain the importance of statistics in other fields:
Why is Statistics Important? (10 Reasons Statistics Matters!)
The Importance of Statistics in Business
The Importance of Statistics in Accounting
The Importance of Statistics in Education
The Importance of Statistics in Healthcare