The field of statistics is concerned with collecting, analyzing, interpreting, and presenting data.
In a business setting, statistics is important for the following reasons:
Reason 1: Statistics allows a business to understand consumer behavior better using descriptive statistics.
Reason 2: Statistics allows a business to spot trends using data visualization.
Reason 3: Statistics allows a business to understand the relationship between different variables using regression models.
Reason 4: Statistics allows a business to segment consumers into groups using cluster analysis.
In the rest of this article, we elaborate on each of these reasons.
Reason 1: Understand Consumer Behavior Using Descriptive Statistics
Descriptive statistics are used to describe datasets.
Businesses in almost every field use descriptive statistics to gain a better understanding of how their consumers behave.
For example, a grocery store might calculate the following descriptive statistics:
- The mean number of customers who come in each day.
- The median sales order per customer.
- The standard deviation of the age of the customers who come in the store.
- The sum of the sales made each month.
Using these metrics, the store can gain a strong understanding of who their customers are and how they behave.
On the other hand, a bank might calculate the following descriptive statistics:
- The percentage of customers who default on their loan.
- The mean number of new customers who join the bank each day.
- The sum of the total deposits made by all customers each month.
Using these metrics, the bank can get an idea of how their customers behave and how they handle their money.
Not all businesses build statistical models or perform complex calculations, but just about every business uses descriptive statistics to gain a better understanding of their customers.
Reason 2: Spot Trends Using Data Visualization
Another common way that statistics is used in business is through data visualizations such as line charts, histograms, boxplots, pie charts and other charts.
These types of charts are often used to help a business spot trends.
For example, a small business might create the following combo chart to visualize the number o f new clients and total sales they make each month:
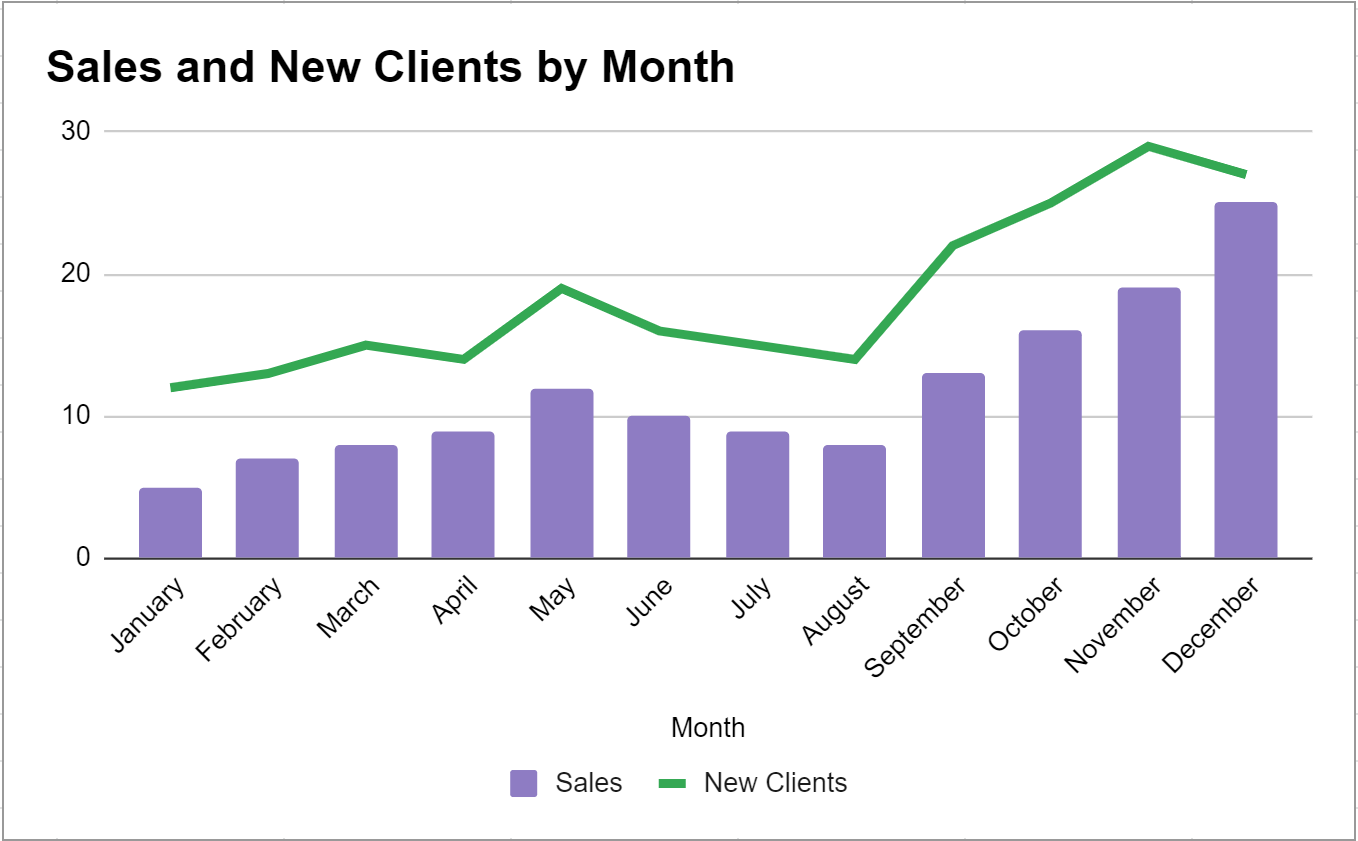
Using this simple chart, the business can quickly see that both their sales and number of new clients tends to increase the most in the final quarter of the year.
This can allow the business to be prepared with more staff, later hours, more inventory, etc. during this time of year.
Reason 3: Understand the Relationship Between Variables Using Regression Models
Another way that statistics is used in business settings is in the form of linear regression models.
These are models that allow a business to understand the relationship between one or more predictor variables and a response variable.
For example, a grocery store might track their total amount spent on print advertising, their total amount spent on online advertising, and their total revenue.
They might then build the following multiple linear regression model:
Sales = 840.35 + 2.55(TV advertising) + 4.87(online advertising)
Here’s how to interpret the regression coefficients in this model:
- For each additional dollar spent on TV advertising, the total revenue increases by $2.55 (assuming online advertising is held constant).
- For each additional dollar spent on online advertising, the total revenue increases by $4.87 (assuming TV advertising is held constant).
Using this model, the grocery store can quickly see that their money is better spent on online advertising as opposed to TV advertising.
Note: In this example, we only used two predictor variables (TV advertising and online advertising), but in practice businesses often build regression models with far more predictor variables.
Reason 4: Segment Consumers into Groups Using Cluster Analysis
Another way that statistics is used in business settings is in the form of cluster analysis.
This is a machine learning technique that allows a business to group together similar people based on different attributes.
Retail companies often use clustering to identify groups of households that are similar to each other.
For example, a retail company may collect the following information on households:
- Household income
- Household size
- Head of household Occupation
- Distance from nearest urban area
They can then feed these variables into a clustering algorithm to perhaps identify the following clusters:
- Cluster 1: Small family, high spenders
- Cluster 2: Larger family, high spenders
- Cluster 3: Small family, low spenders
- Cluster 4: Large family, low spenders
The company can then send personalized advertisements or sales letters to each household based on how likely they are to respond to specific types of advertisements.
Additional Resources
The following articles explain the importance of statistics in other fields:
The Importance of Statistics in Economics
The Importance of Statistics in Education
The Importance of Statistics in Healthcare