The median represents the middle value of a dataset, when all of the values are arranged from smallest to largest.
For example, the median in the following dataset is 19:
Dataset: 3, 4, 11, 15, 19, 22, 23, 23, 26
The median also represents the 50th percentile of a dataset. That is, exactly half of the values in the dataset are larger than the median and half of the values are lower.
The median is an important metric to calculate because it gives us an idea of where the “center” of a dataset is located. It also gives us an idea of the “typical” value in a given dataset.
For example, suppose we have a dataset that contains the selling price of 10,000 different homes in a certain city.
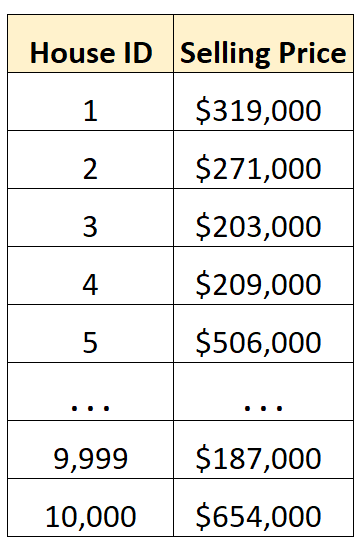
Instead of staring at rows and rows of raw data, we can calculate the median value to quickly understand the middle selling price of homes in this city.
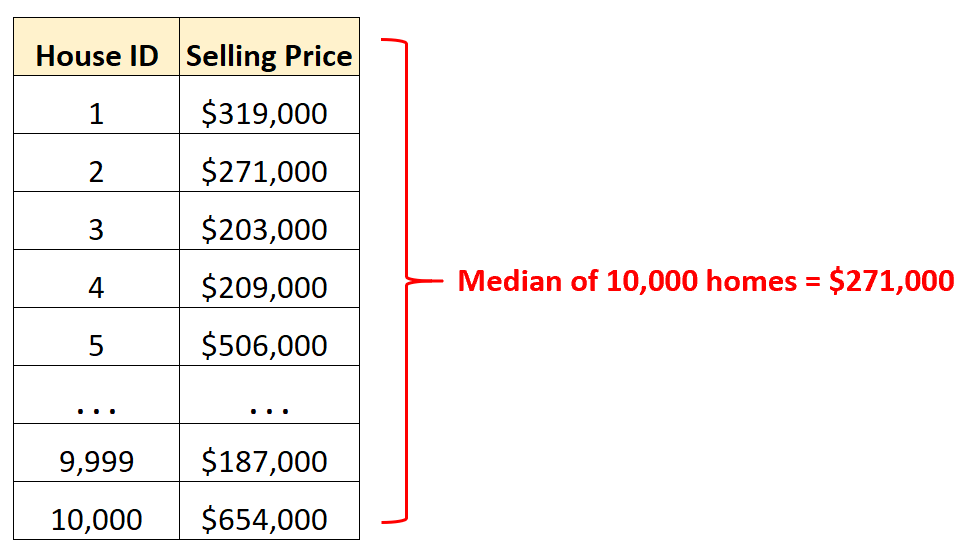
By knowing that the median selling price is $271,000, we know that exactly half of the 10,000 homes sold for more than this amount and half sold for less.
This also gives us an idea of the “typical” selling price of homes in this city.
When to Use the Median
When analyzing datasets, we’re often interested in understanding where the center value is located.
In statistics, there are two common metrics that we use to measure the center of a dataset:
- Mean: The average value in a dataset
- Median: The middle value in a dataset
It turns out that the median is a more useful metric in the following circumstances:
- When the distribution is skewed.
- When the distribution contains outliers.
To illustrate this, consider the following two examples.
Example 1: Calculating the Median of a Skewed Distribution
Consider the following distribution of salaries for residents in a certain city:
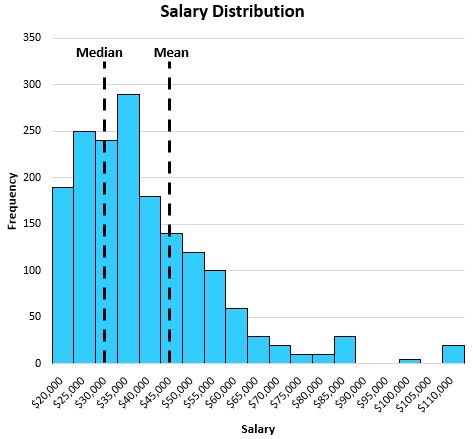
The median does a better job of capturing the “typical” salary of a resident than the mean because the distribution is right-skewed.
This means the large salaries on the right side of the distribution pull the mean away from the center of the distribution.
In this particular example, the mean salary is $47,000 while the median salary is $32,000. The median is much more representative of the typical salary in this city.
Example 2: Calculating the Median When Outliers Are Present
Consider the following chart that shows the square footage of houses on a certain street:
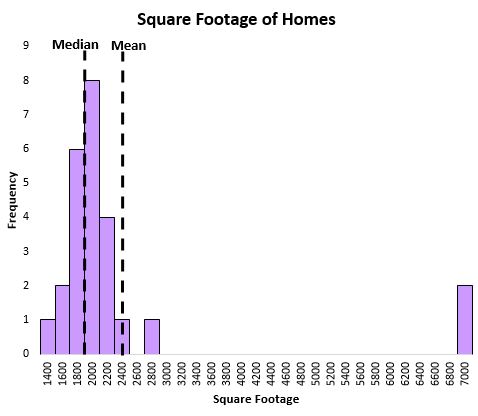
The mean is heavily influenced by a couple extremely large houses, while the median is not.
We can see that the median does a better job of capturing the “typical” square footage of a house on this street compared to the mean because it isn’t influenced by the extreme outlier values.
Summary
Here’s a quick summary of the main points made in this article:
- The median represents the middle value in a dataset.
- The median is important because it gives us an idea of where the center value is located in a dataset.
- The median tends to be more useful to calculate than the mean when a distribution is skewed and/or has outliers.
Additional Resources
Real Life Examples: Using Mean, Median, & Mode
When to Use Mean vs. Median (With Examples)
Why is the Mode Important in Statistics?