A two-way ANOVA is used to determine whether or not there is a statistically significant difference between the means of three or more independent groups that have been split on two variables.
When reporting the results of a two-way ANOVA, we always use the following general structure:
- A brief description of the independent and dependent variables.
- Whether or not there was a significant interaction effect between the two independent variables.
- Whether or not the two independent variables had a statistically significant effect on the dependent variable.
Here’s the exact wording we can use:
A two-way ANOVA was performed to analyze the effect of [independent variable 1] and [independent variable 2] on [dependent variable].
A two-way ANOVA revealed that there [was or was not] a statistically significant interaction between the effects of [independent variable 1] and [independent variable 2] (F(df interaction, df within) = [F-value], p = [p-value]).
Simple main effects analysis showed that [independent variable 1] [did or did not] have a statistically significant effect on [dependent variable] (p = [p-value]).
Simple main effects analysis showed that [independent variable 2] [did or did not] have a statistically significant effect on [dependent variable] (p = [p-value]).
The following example shows how to report the results of a two-way ANOVA in practice.
Example: Reporting the Results of a Two-Way ANOVA
A botanist wants to know whether different levels of sunlight exposure and watering frequency effect plant growth. She plants 40 seeds and lets them grow for one month under different conditions for sunlight exposure and watering frequency.
She then performs a two-way ANOVA to determine if sunlight exposure and watering frequency effect plant growth.
The following table shows the results of the two-way ANOVA:
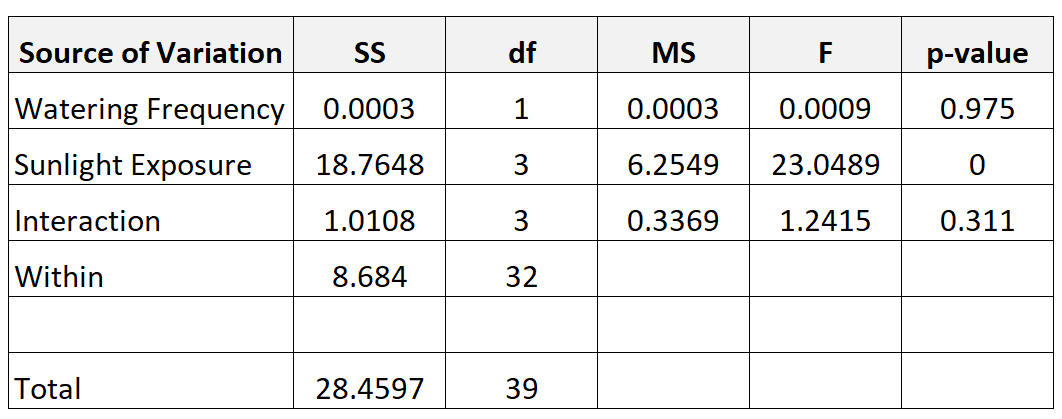
Here is how to report the results of the two-way ANOVA:
A two-way ANOVA was performed to analyze the effect of watering frequency and sunlight exposure on plant growth.
A two-way ANOVA revealed that there was not a statistically significant interaction between the effects of watering frequency and sunlight exposure (F(3, 32) = 1.242, p = .311).
Simple main effects analysis showed that watering frequency did not have a statistically significant effect on plant growth (p = .975).
Simple main effects analysis showed that sunlight exposure did have a statistically significant effect on plant growth (p
Things to Keep in Mind
Here are a few things to keep in mind when reporting the results of a two-way ANOVA:
1. Use a descriptive statistics table if necessary.
- It can be helpful to present a descriptive statistics table that shows the mean and standard deviation of values in each treatment group as well to give the reader a more complete picture of the data.
2. Round p-values when necessary.
- As a rule of thumb, the overall F-value and any p-values in ANOVA results are rounded to either two or three decimal places for brevity.
- No matter how many decimal places you choose to use, simply be consistent throughout the report.
Additional Resources
The following tutorials explain how to report other statistical tests and procedures in APA format:
How to Report One-Way ANOVA Results (With Examples)
How to Report Cronbach’s Alpha (With Examples)
How to Report t-Test Results (With Examples)
How to Report Pearson’s Correlation (With Examples)
How to Report Regression Results (With Examples)