We can use the following general format to report the results of a one sample t-test:
A one sample t-test was performed to compare [variable of interest] against the population mean.
The mean value of [variable of interest] (M = [Mean], SD = [standard deviation]) was significantly [higher, lower, or different] than the population mean; t(df) = [t-value], p = [p-value].
We can use the following format to report the results of an independent two samples t-test:
A two sample t-test was performed to compare [response variable of interest] in [group 1] and [group 2].
There [was or was not] a significant difference in [response variable of interest] between [group1] (M = [Mean], SD = [standard deviation]) and [group2] (M = [Mean], SD = [standard deviation]); t(df) = [t-value], p = [p-value].
We can use the following format to report the results of a paired samples t-test:
A paired samples t-test was performed to compare [response variable of interest] in [group 1] and [group 2].
There [was or was not] a significant difference in [response variable of interest] between [group1] (M = [Mean], SD = [standard deviation]) and [group2] (M = [Mean], SD = [standard deviation]); t(df) = [t-value], p = [p-value].
Note: The “M” in the results stands for sample mean, the “SD” stands for sample standard deviation, and “df” stands for degrees of freedom associated with the t-test statistic.
The following examples show how to report the results of each type of t-test in practice.
Example: Reporting Results of a One Sample T-Test
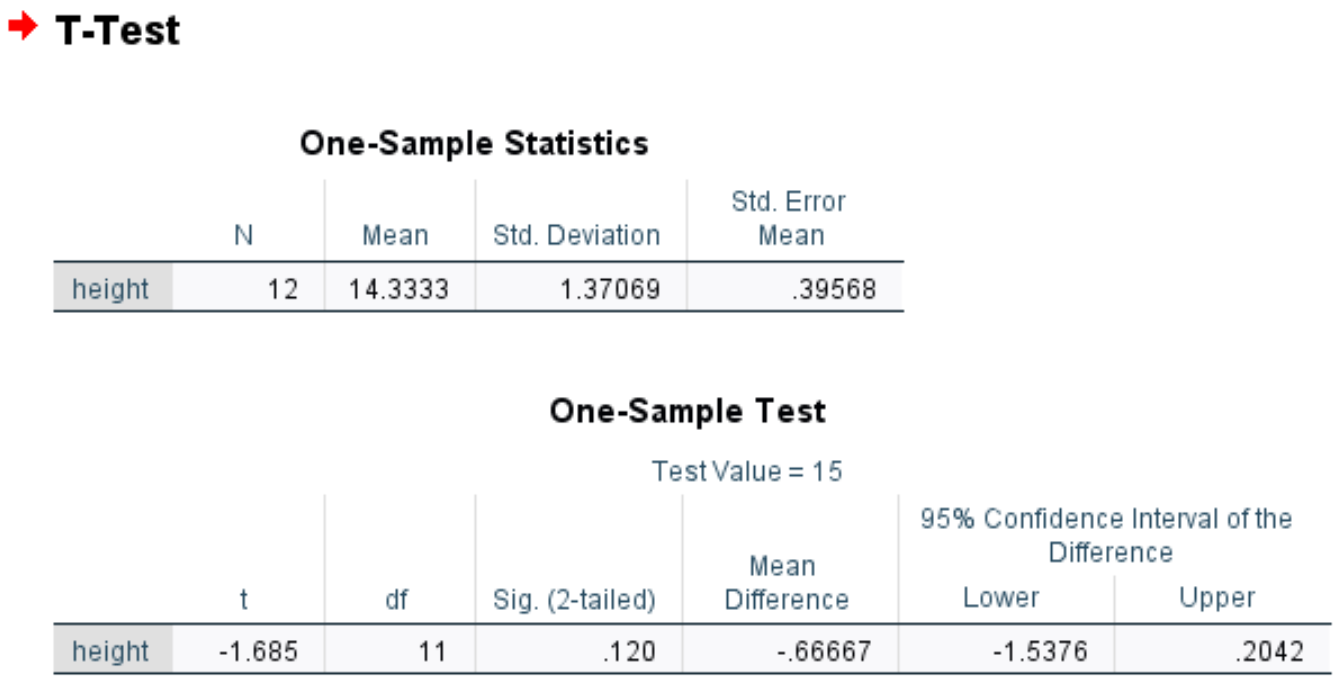
A botanist wants to know if the mean height of a certain species of plant is equal to 15 inches. She collects a random sample of 12 plants and performs a one sample-test.
The following screenshot shows the results of the test:
Here’s how to report the results of the test:
A one sample t-test was performed to compare the mean height of a certain species of plant against the population mean.
The mean value of height (M = 14.33, SD = 1.37) was not significantly different than the population mean; t(11) = -1.685, p = .120.
Example: Reporting Results of an Independent Samples T-Test
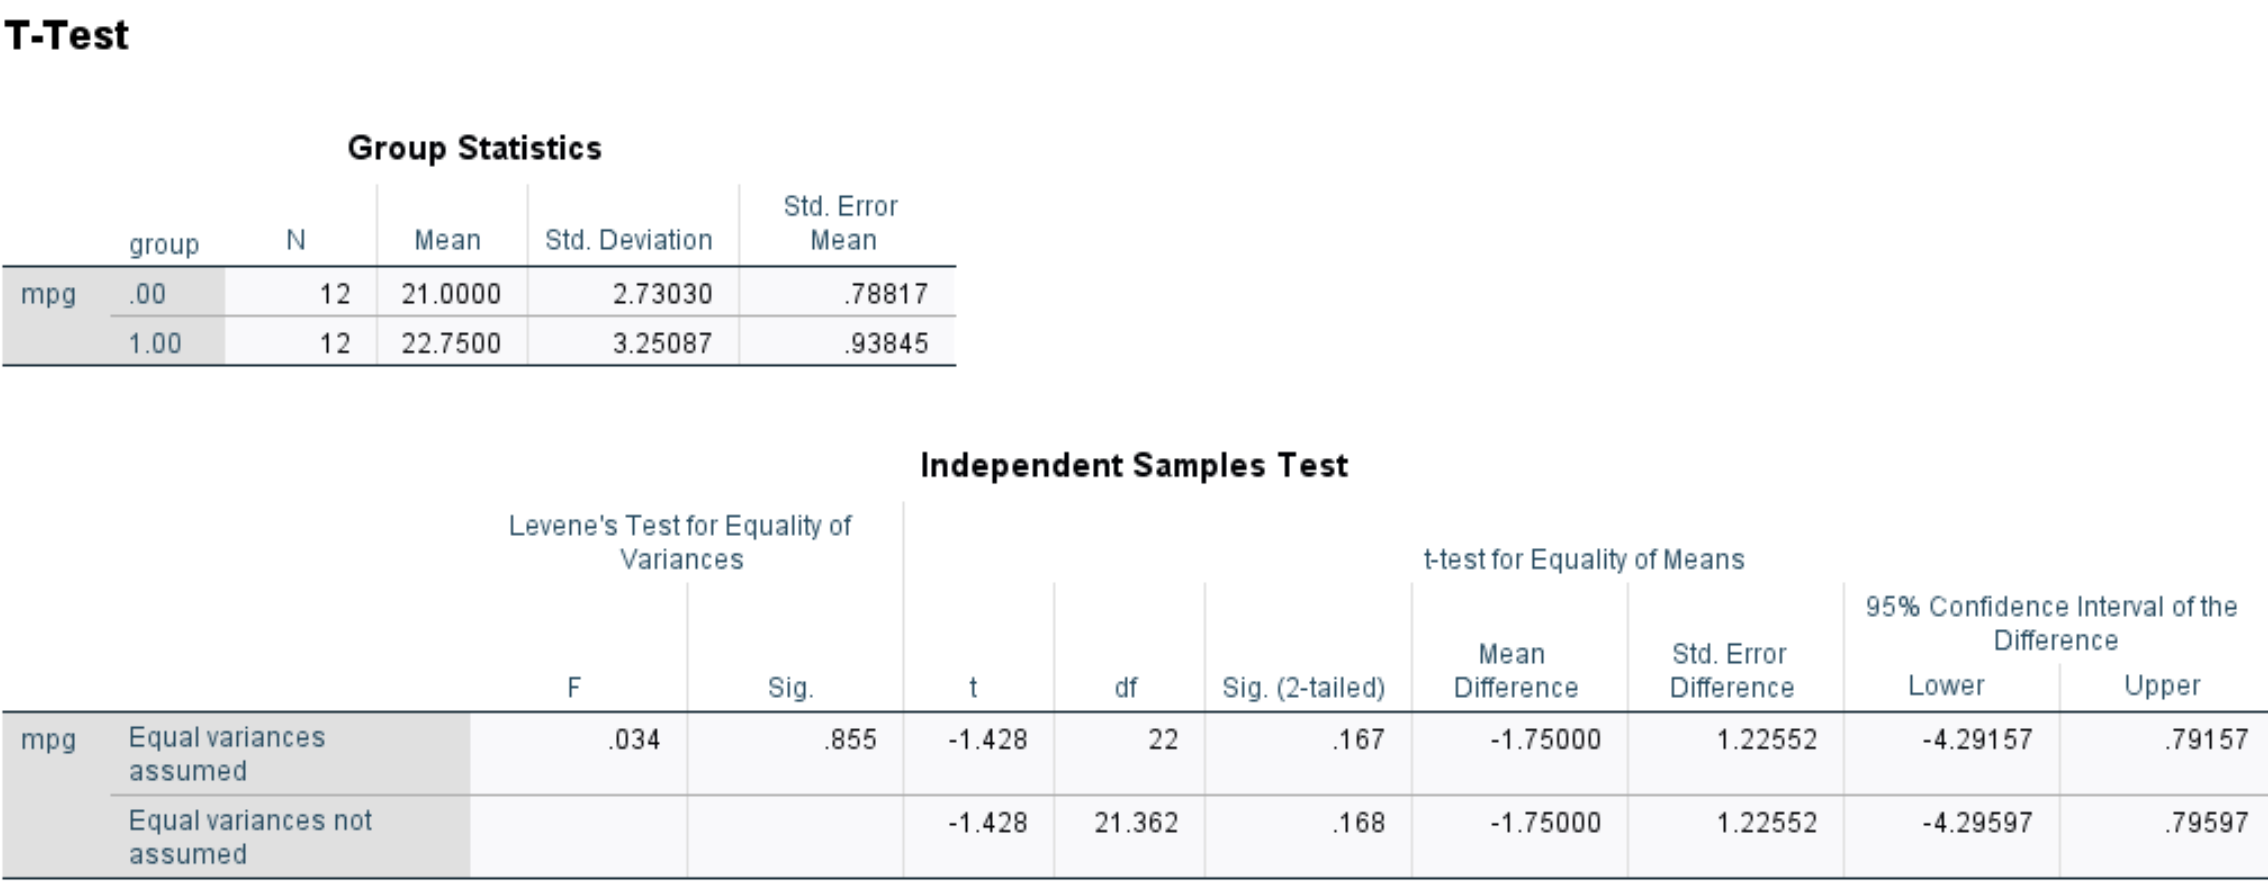
Researchers want to know if a new fuel treatment leads to a change in the average miles per gallon of a certain car. To test this, they conduct an experiment in which 12 cars receive the new fuel treatment and 12 cars do not.
The following screenshot shows the results of the independent samples t-test:
Here’s how to report the results of the test:
A two sample t-test was performed to compare miles per gallon between fuel treatment and no fuel treatment.
There was not a significant difference in miles per gallon between fuel treatment (M = 22.75, SD = 3.25) and no fuel treatment (M = 21, SD = 2.73); t(22) = -1.428, p = .167.
Example: Reporting Results of a Paired Samples T-Test
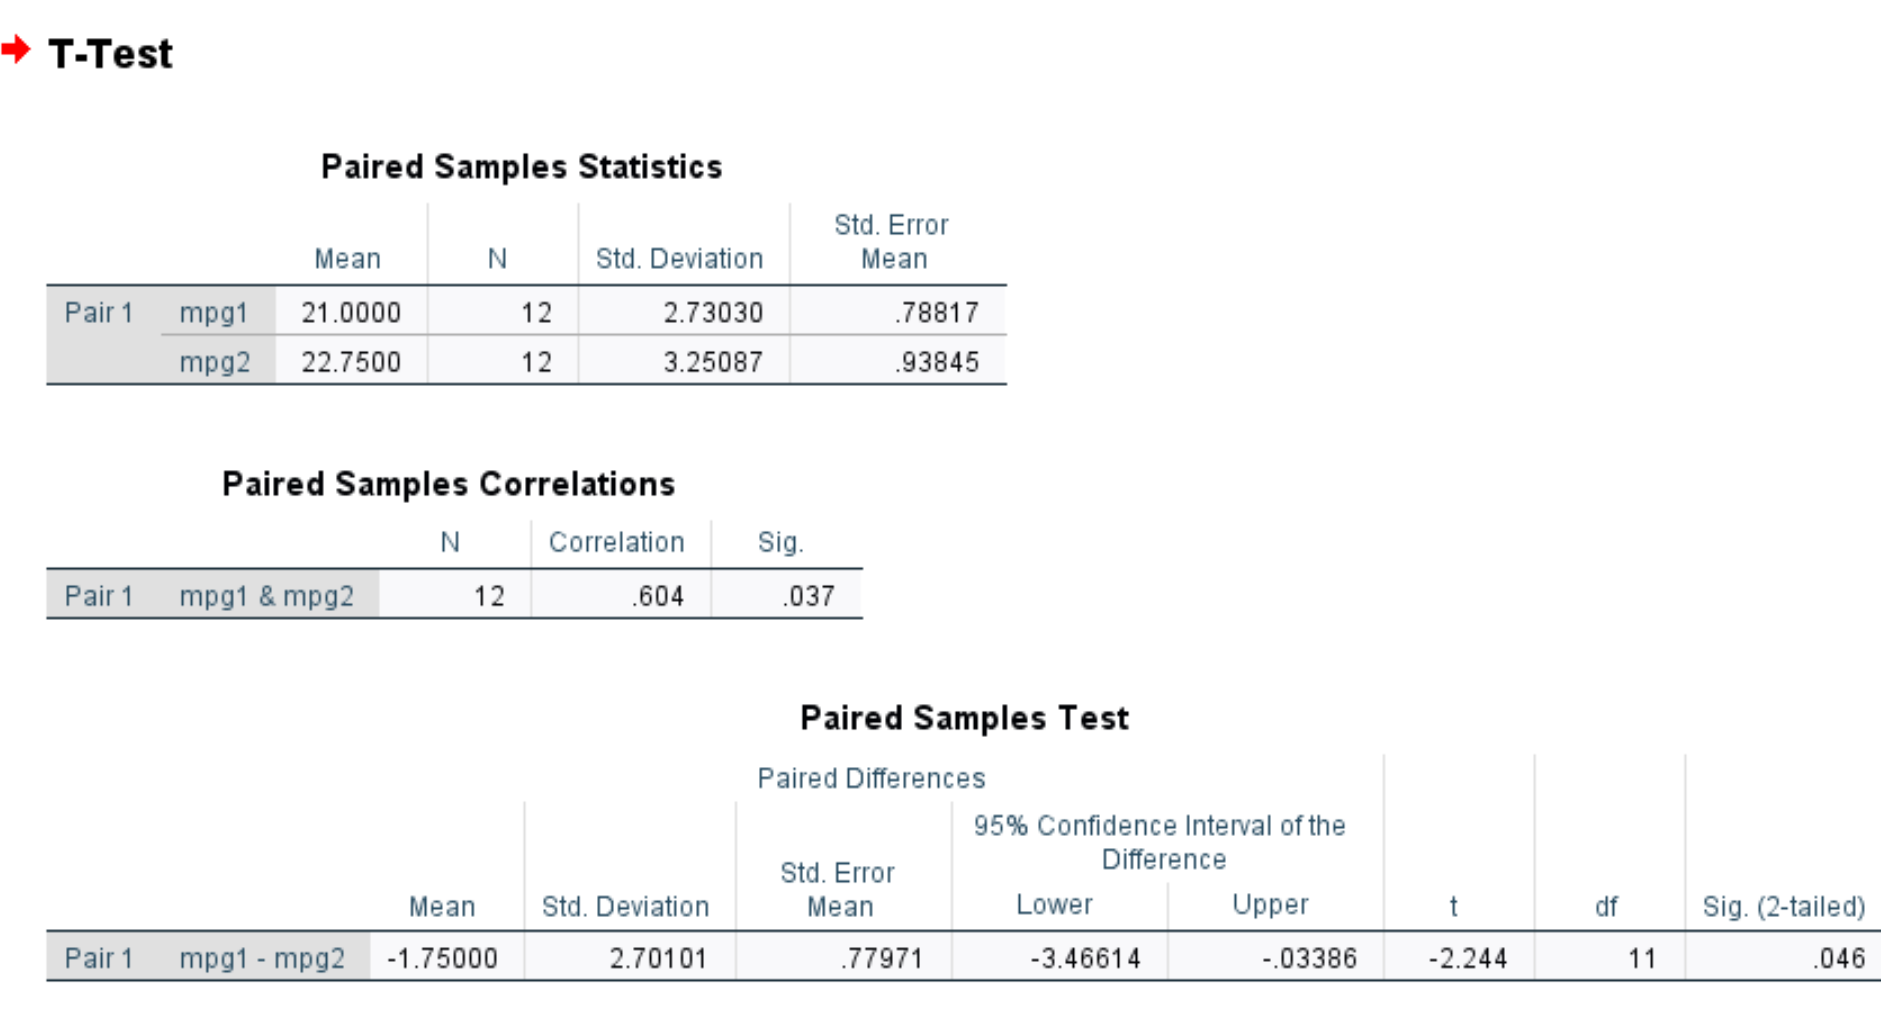
Researchers want to know if a new fuel treatment leads to a change in the average mpg of a certain car. To test this, they conduct an experiment in which they measure the mpg of 12 cars with and without the fuel treatment.
The following screenshot shows the results of the paired samples t-test:
Here’s how to report the results of the test:
A paired samples t-test was performed to compare miles per gallon between fuel treatment and no fuel treatment.
There was a significant difference in miles per gallon between fuel treatment (M = 22.75, SD = 3.25) and no fuel treatment (M = 21, SD = 2.73); t(11) = -2.244, p = .046.
Additional Resources
Use the following calculators to automatically perform various t-tests:
One Sample t-test Calculator
Two Sample t-test Calculator
Paired Samples t-test Calculator