In statistics, p-values are used in hypothesis testing with t-tests, Chi-square tests, regression models, ANOVA models, and a variety of other statistical methods.
When reporting p-values in a formal report, you should adhere to the following guidelines:
- A p-value larger than .01 should be reported to two decimal places, p-values between .01 and .001 to three decimal places, and p-values less than .001 simply as p
- Do not write a zero in front of the p-value.
- Never write p = .000 (although some statistical software report this) because it’s not possible. Instead, write p
- Report the test statistic along with the p-value to give the reader complete information.
It’s important to note that there is no standard way to write p-values in reports. Different journals and institutions have different standard formats, but the most common ones you’ll encounter include:
- p
- p value
- p-value
- P value
- P
Before writing your results, you should check the standard format used by the journal or institution where your report will be published.
The following examples show how to report p-values from different statistical tests.
Example 1: How to Report P-Values from a t-Test
Suppose researchers want to know if a new fuel treatment leads to a change in the average miles per gallon of a certain car.
To test this, they conduct an experiment in which 12 cars receive the new fuel treatment and 12 cars do not.
The following screenshot shows the results of the independent samples t-test:
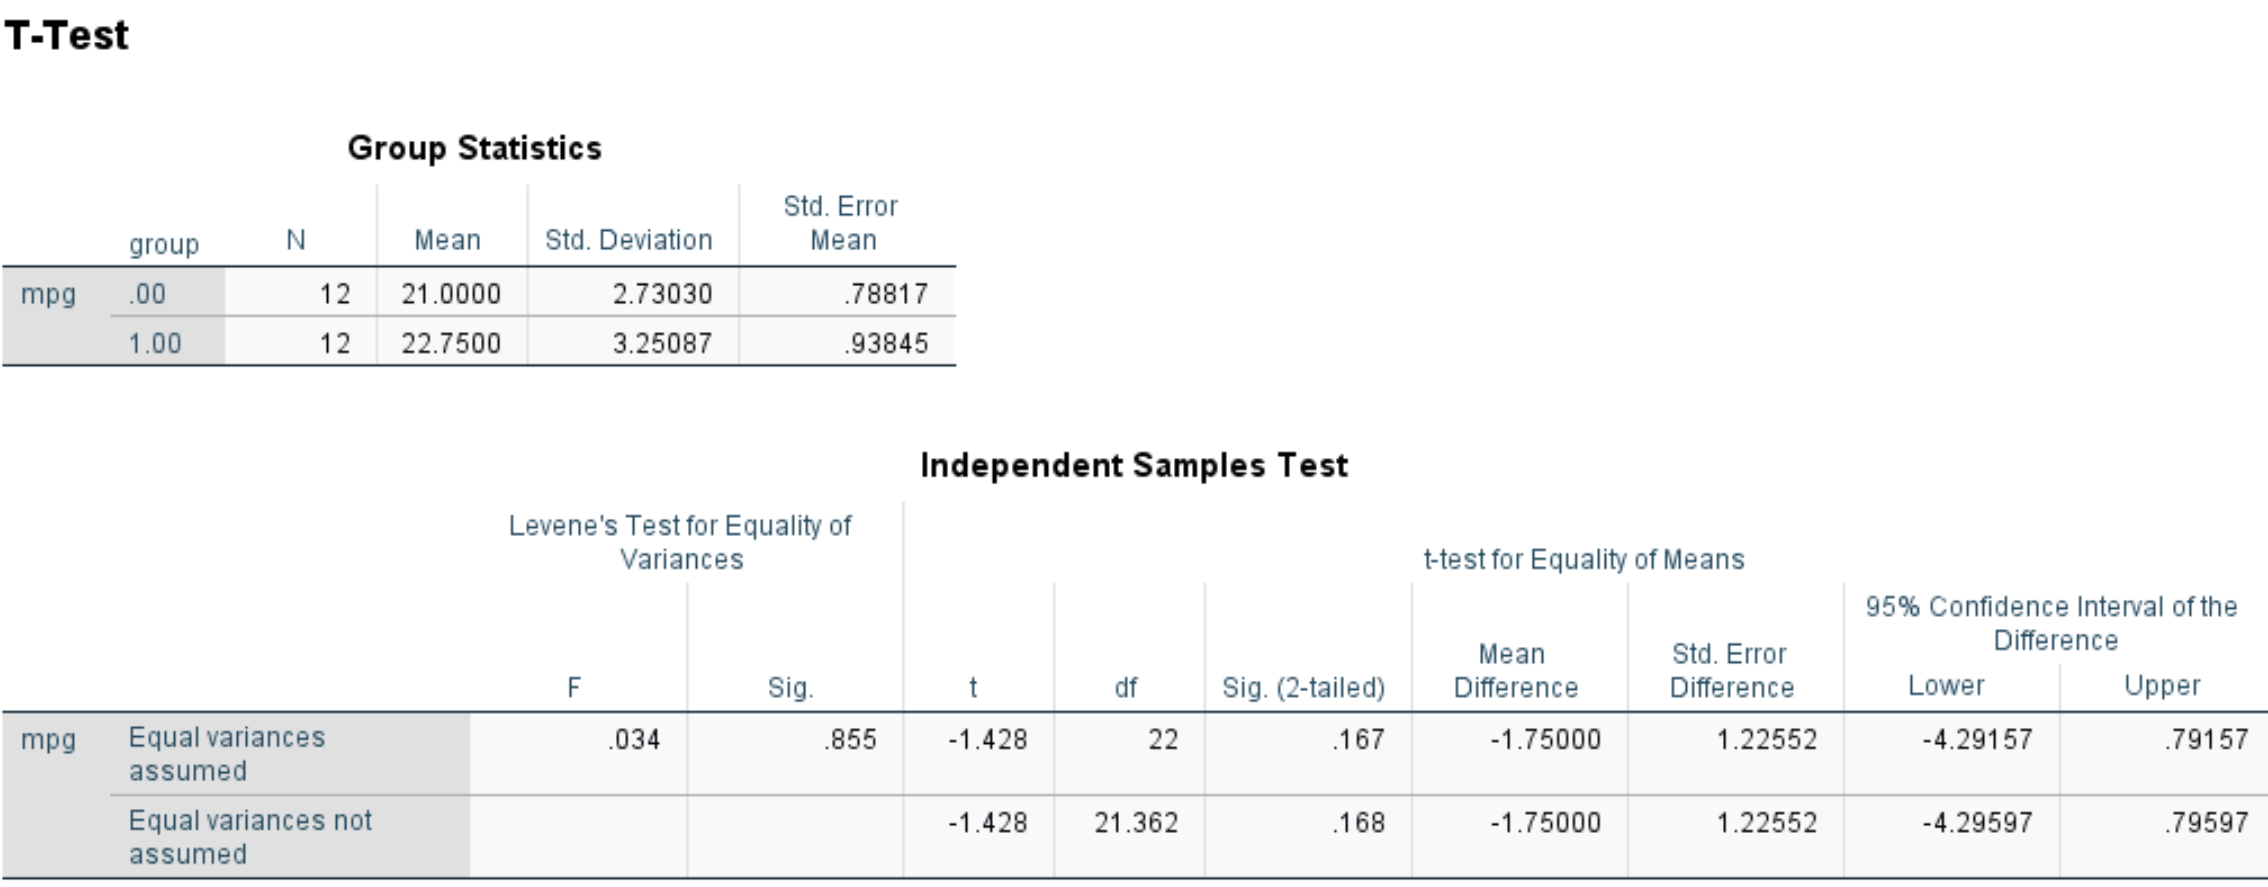
Here’s how to report the results of the test:
A two sample t-test was performed to compare miles per gallon between fuel treatment and no fuel treatment.
There was not a significant difference in miles per gallon between fuel treatment (M = 22.75, SD = 3.25) and no fuel treatment (M = 21, SD = 2.73); t(22) = -1.428, p = .17.
In this example, since the p-value was greater than .01 we only reported the value to two decimal places.
Example 2: How to Report P-Values from a Chi-Square Test
Suppose a professor collects data on political party preference and gender among his students.
He performs a Chi-Square Test of Independence to determine if there is a significant relationship between the two variables.
The test returns the following results:
- X2 test statistic: 15.33
- p-value = .004
Here is how to report the results in APA format:
A Chi-Square Test of Independence was performed to assess the relationship between political party preference and gender.
There was a significant relationship between the two variables, X2(2, N=500) = 15.33, p = .004.
In this example, since the p-value was between .01 and .001 we reported the value to three decimal places.
Example 3: How to Report P-Values from a Two Proportion Z-Test
Suppose researchers want to know if there is a difference in the proportion of residents who support a certain law in county A compared to the proportion who support the law in county B.
They survey a simple random sample of 50 residents from each county and then perform a two proportion z-test with the following results
The test returns the following results:
- z test statistic: 4.77
- p-value = .000
Here is how to report the results in APA format:
A two proportion z-test was performed to determine if there was a difference in the proportion of residents who supported a certain law between county A and county B.
There was a significant difference in the proportion of residents who supported the law between the two counties, z = 4.77, p
In this example, since the p-value was reported as .000 by the software, we reported the value as p
Related: How to Interpret a P-Value of 0.000
Additional Resources
The following tutorials explain how to report the results of other statistical methods:
How to Report Confidence Intervals
How to Report T-Test Results
How to Report Regression Results
How to Report ANOVA Results