The mean absolute deviation is a way to measure the dispersion for a set of data values.
A low value for the mean absolute deviation is an indication that the data values are concentrated closely together. A high value for the mean absolute deviation is an indication that the data values are more spread out.
The formula to calculate the mean absolute deviation is as follows:
Mean absolute deviation = (Σ |xi – x|) / n
- Σ – just a fancy symbol that means “sum”
- xi – the ith data value
- x – the mean value
- n – sample size
How to Calculate the Mean Absolute Deviation in Excel
To calculate the mean absolute deviation in Excel, we can perform the following steps:
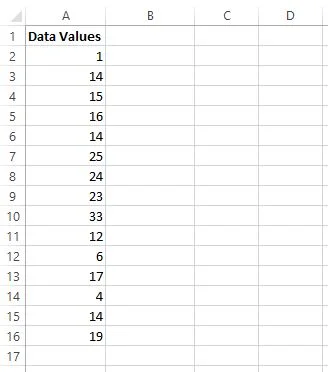
Step 1: Enter the data. For this example, we’ll enter 15 data values in cells A2:A16.
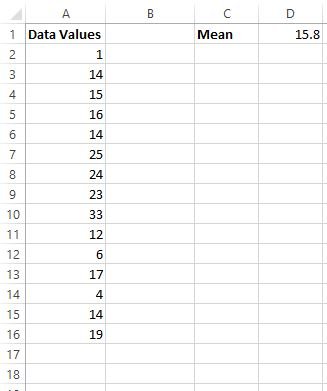
Step 2: Find the mean value. In cell D1, type the following formula: =AVERAGE(A2:A16). This calculates the mean value for the data values, which turns out to be 15.8.
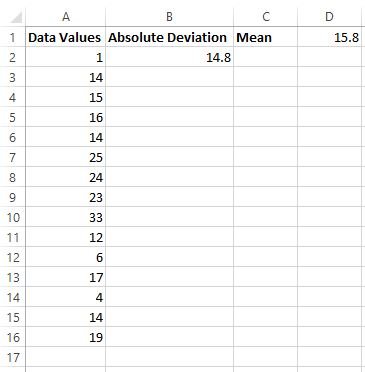
Step 3: Calculate the absolute deviations. In cell B2, type the following formula: =ABS(A2-$D$1). This calculates the absolute deviation of the value in cell A2 from the mean value in the dataset.
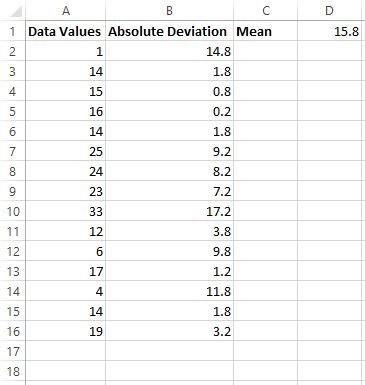
Next, click cell B2. Then, hover over the bottom right corner of the cell until a black + sign appears. Double click the + sign to fill in the remaining values in column B.
Step 4: Calculate the mean absolute deviation. In cell B17, type the following formula: =AVERAGE(B2:B16). This calculates the mean absolute deviation for the data values, which turns out to be 6.1866.
Note that you can use these four steps to calculate the mean absolute deviation for any number of data values. In this example, we used 15 data values but you could use these exact steps to calculate the mean absolute deviation for 5 data values or 5,000 data values.
Another common way to measure the forecasting accuracy of a model is MAPE – mean absolute percentage error. Read about how to calculate MAPE in Excel here.