A histogram is a type of chart that uses rectangular bars to represent frequencies. It’s a helpful way to visualize the distribution of data values.
This tutorial explains how to create and modify histograms in Stata.
How to Create Histograms in Stata
We’ll use a dataset called auto to illustrate how to create and modify histograms in Stata.
First, load the data by typing the following into the Command box:
use https://www.stata-press.com/data/r13/auto
We can get a quick look at the dataset by typing the following into the Command box:
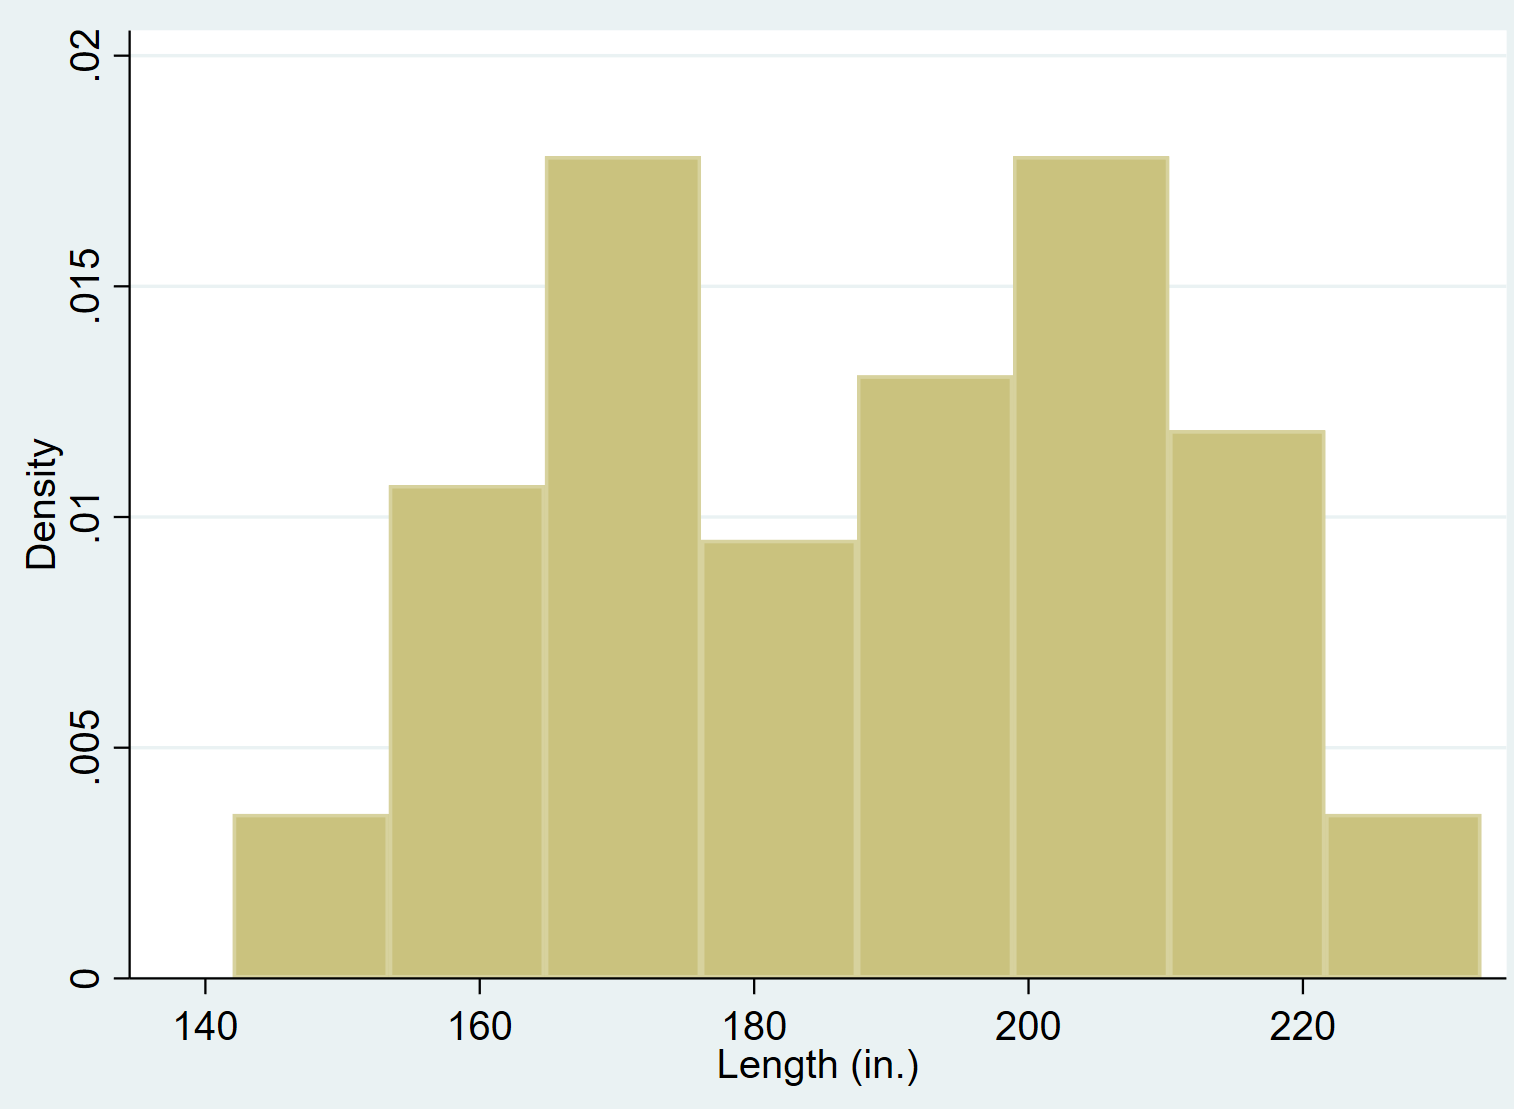
summarize
We can see that there are 12 total variables in the dataset.
Basic Histogram
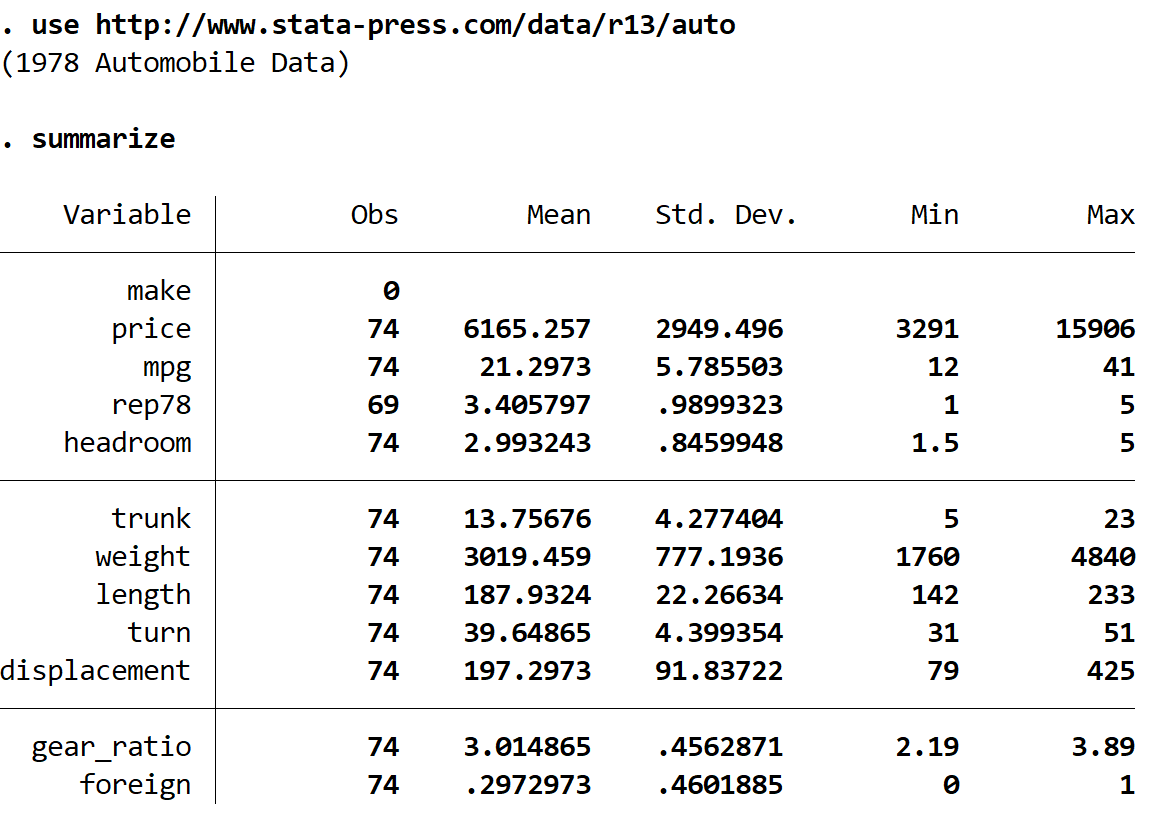
We can create a histogram for the variable length by using the hist command:
hist length
Histogram with Frequencies
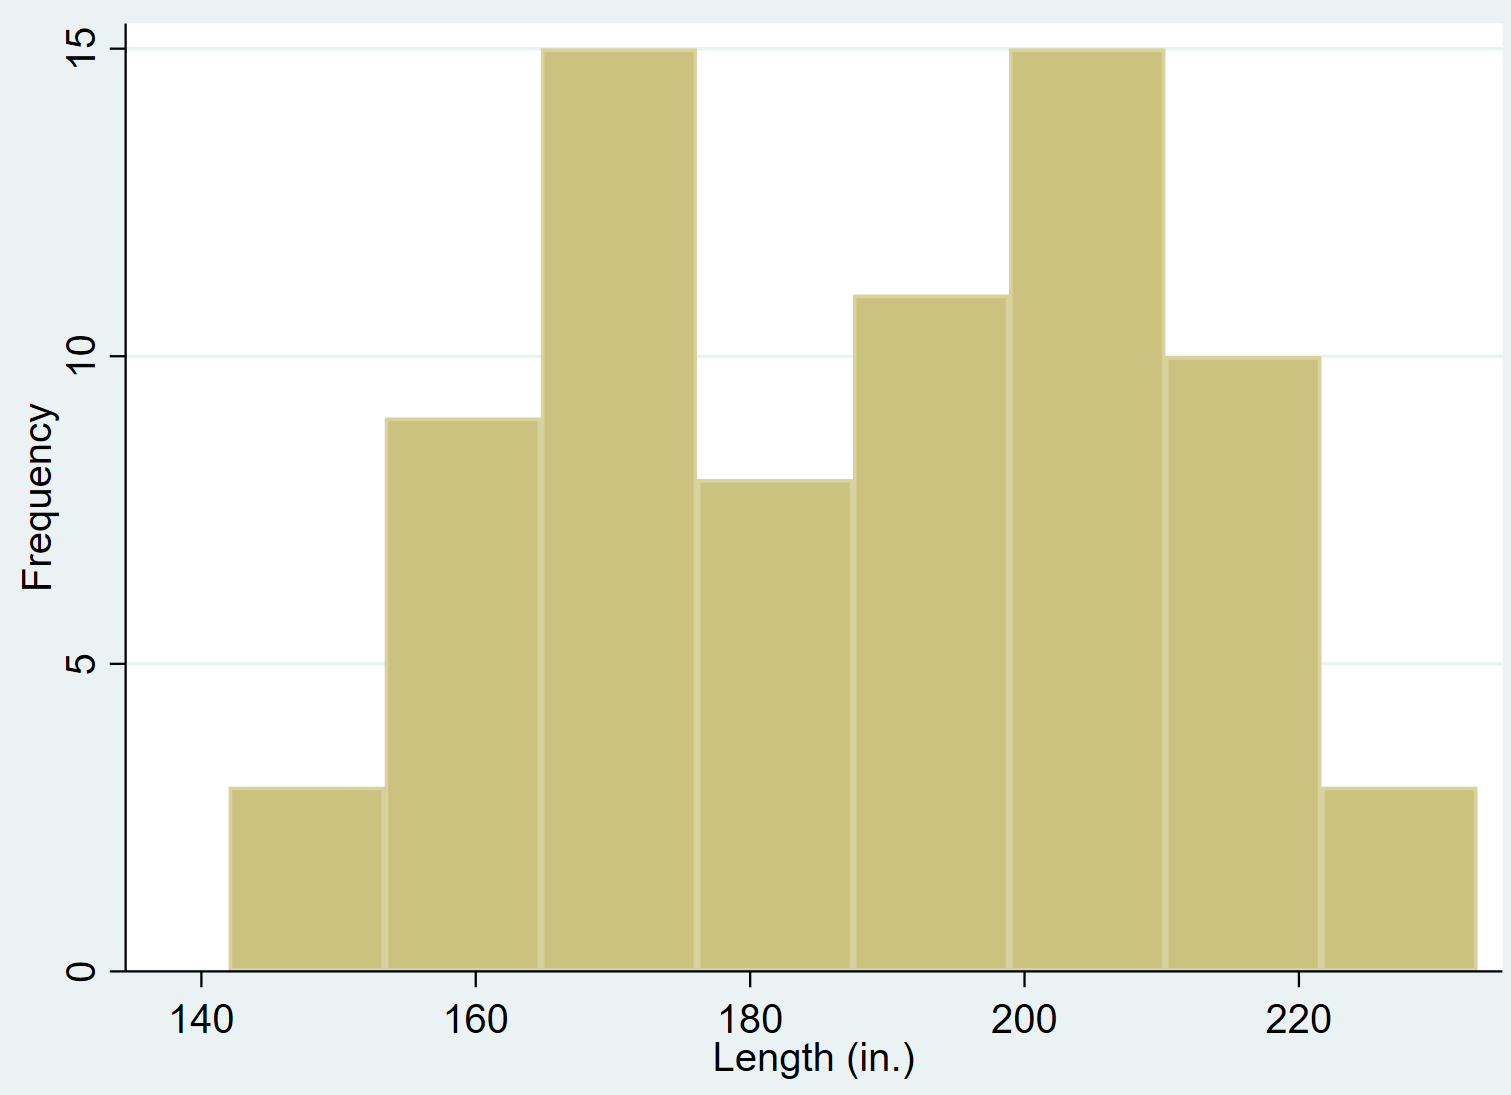
By default, Stata displays the density on the y-axis. You can change the y-axis to display the actual frequencies by using the freq command:
hist length, freq
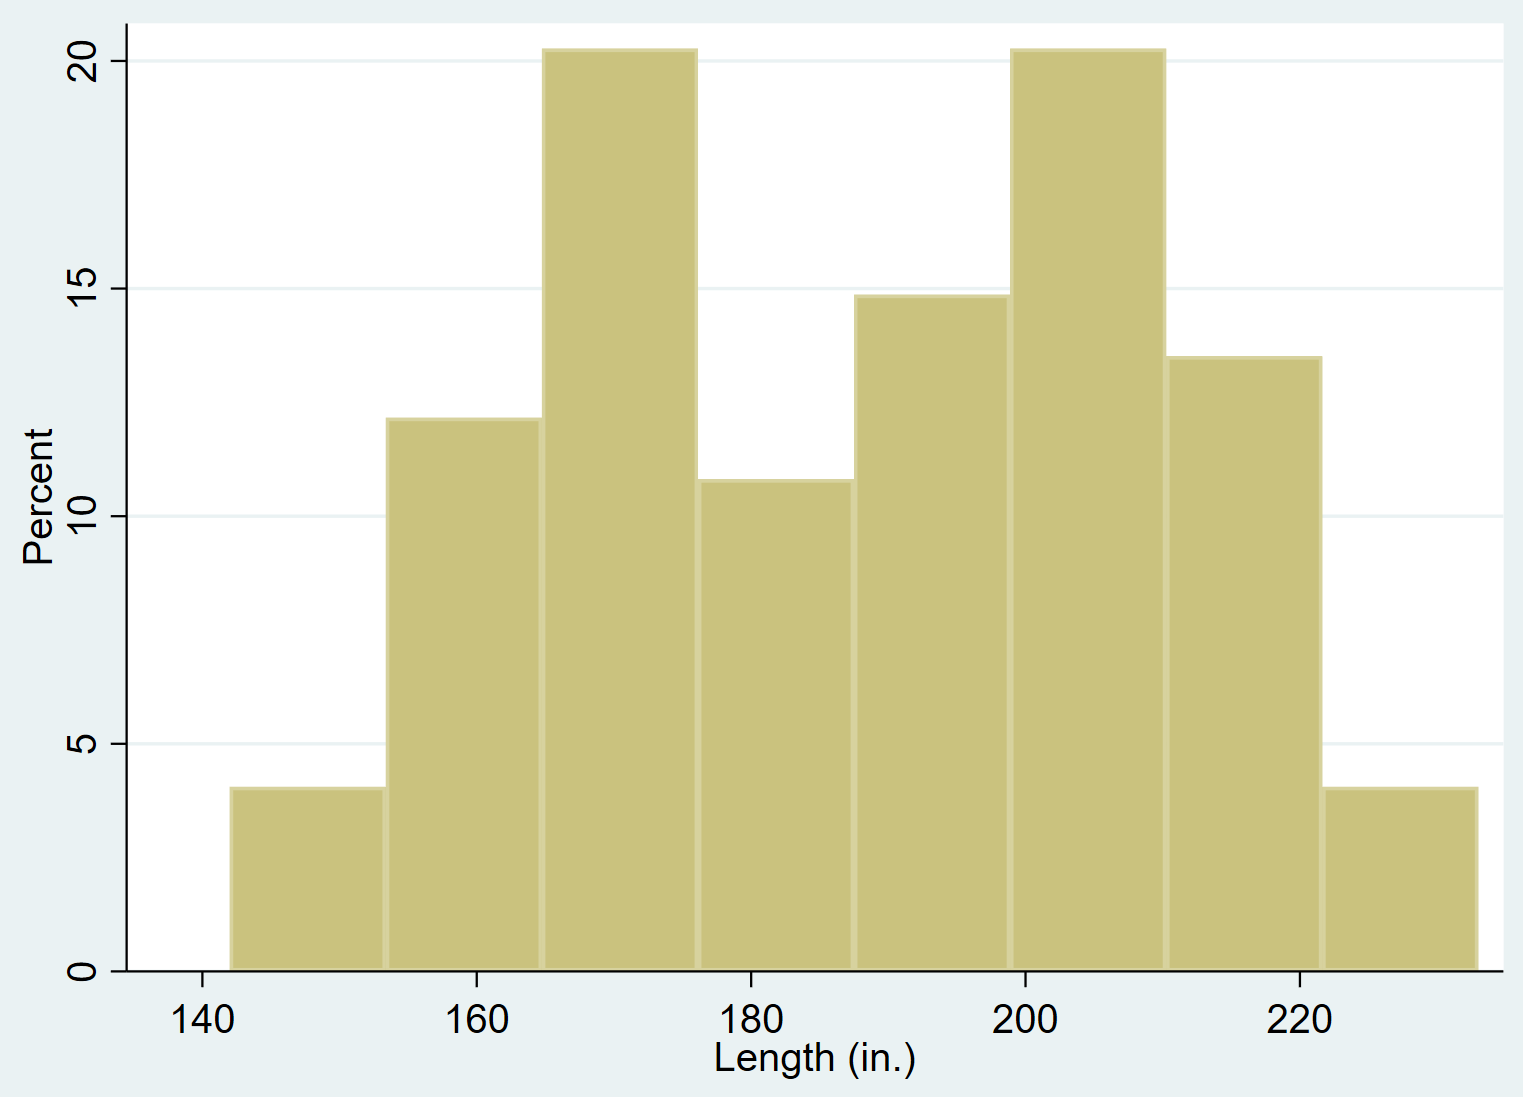
Histogram with Percentages
You can also change the y-axis to display percentages instead of frequencies by using the percent command:
hist length, percent
Changing the Number of Bins
When you use the hist function in Stata, it automatically tells you how many “bins” it used. For example, in the previous examples it always used 8 bins:
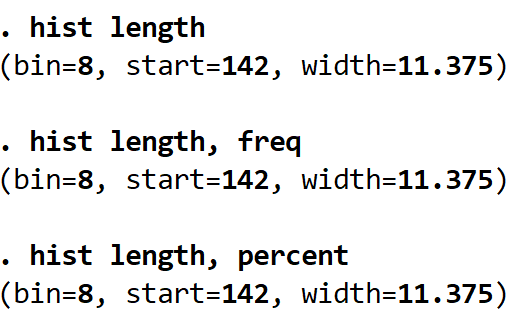
However, we can specify the exact number of bins by using the bin() command. For example, the following code tells Stata to use 16 bins instead of 8:
hist length, percent bin(16)
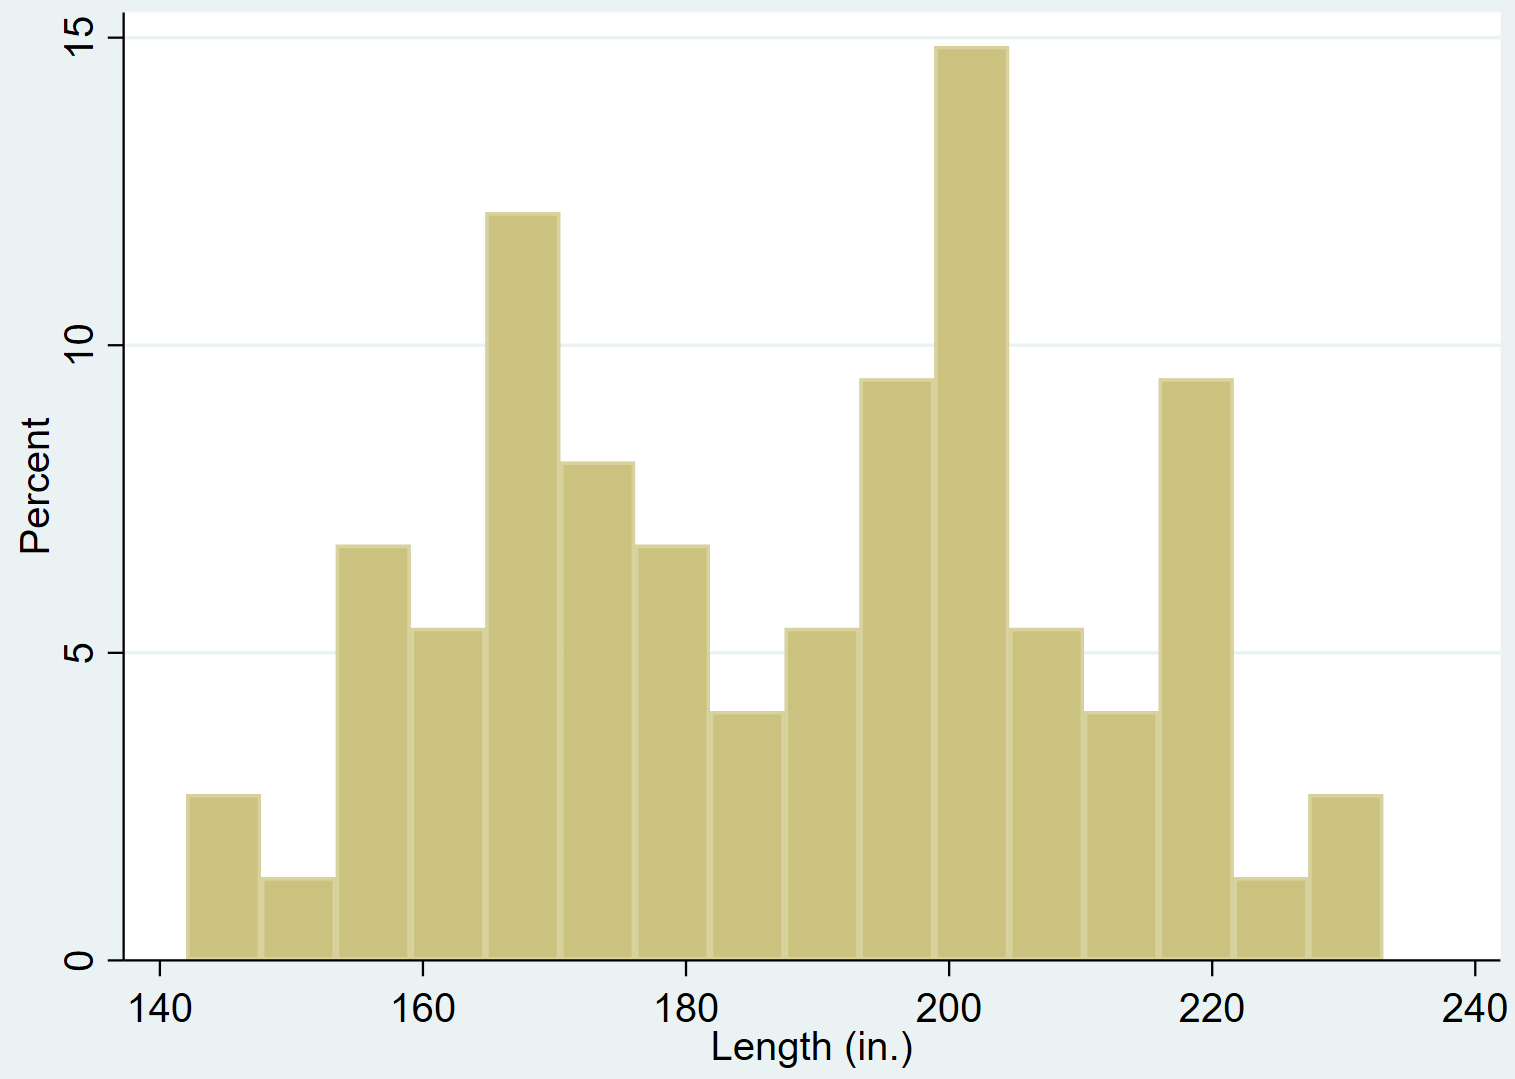
We can also tell Stata to use fewer bins:
hist length, percent bin(4)
Notice that the more bins you use, the more granularity you can see in the data.
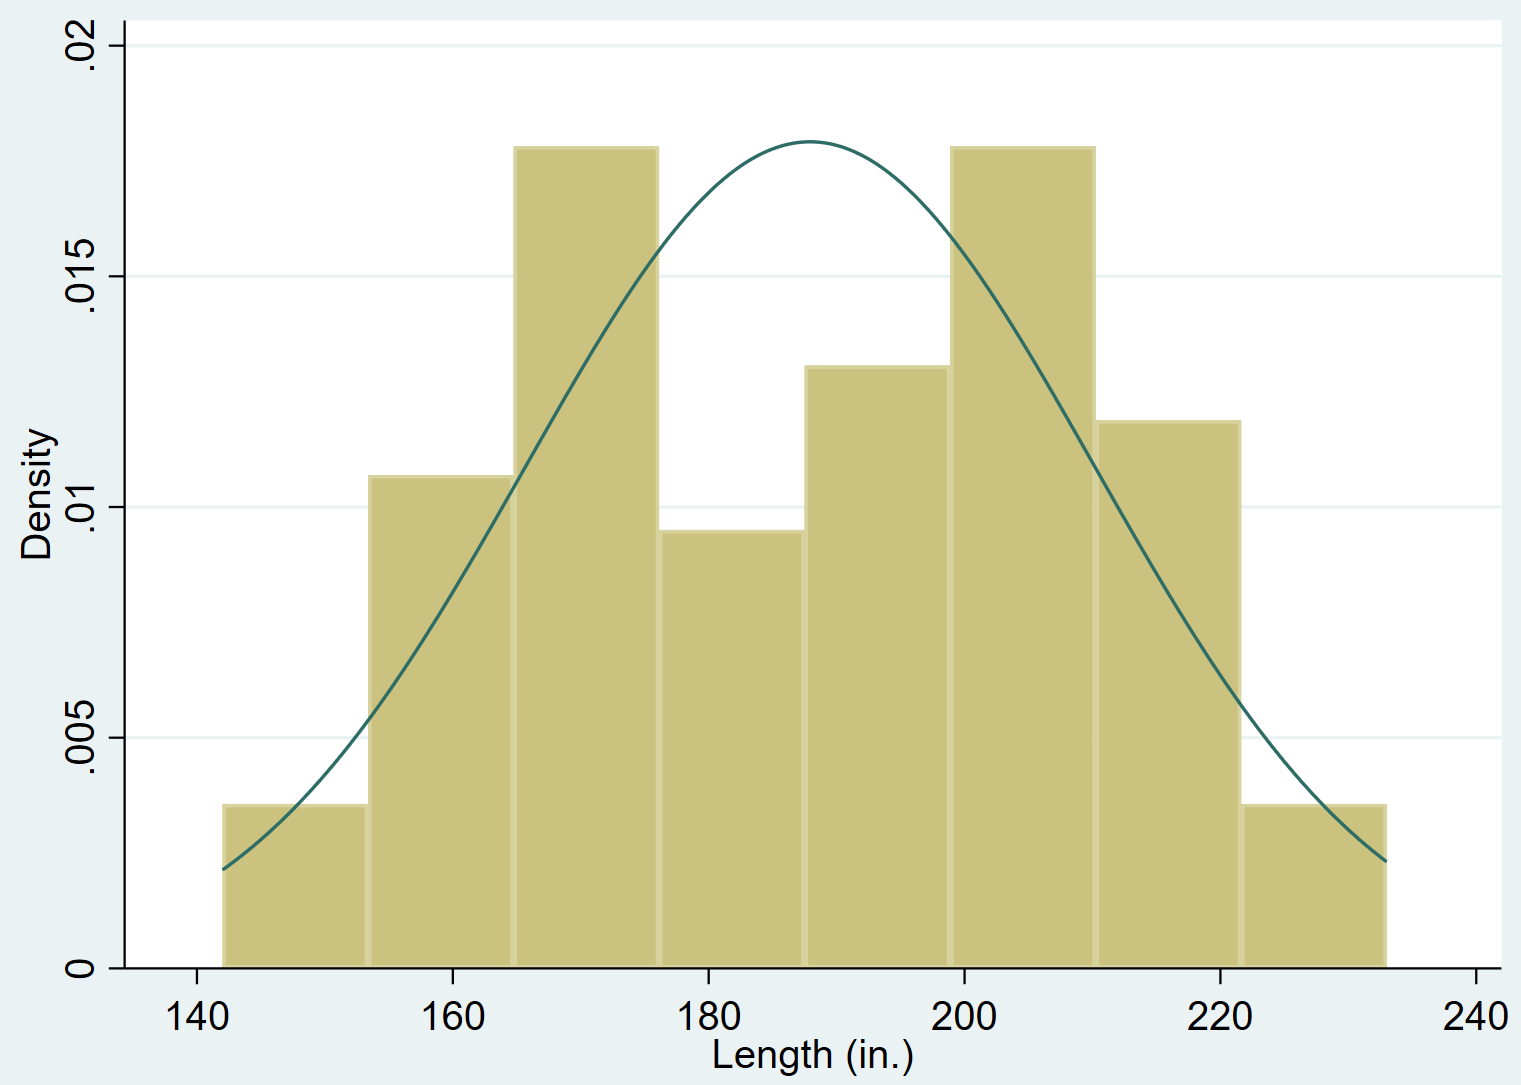
Adding a Normal Density to a Histogram
You can add a normal density curve to a histogram by using the normal command:
hist length, normal
How to Modify Histograms in Stata
We can use several different commands to modify the appearance of the histograms.
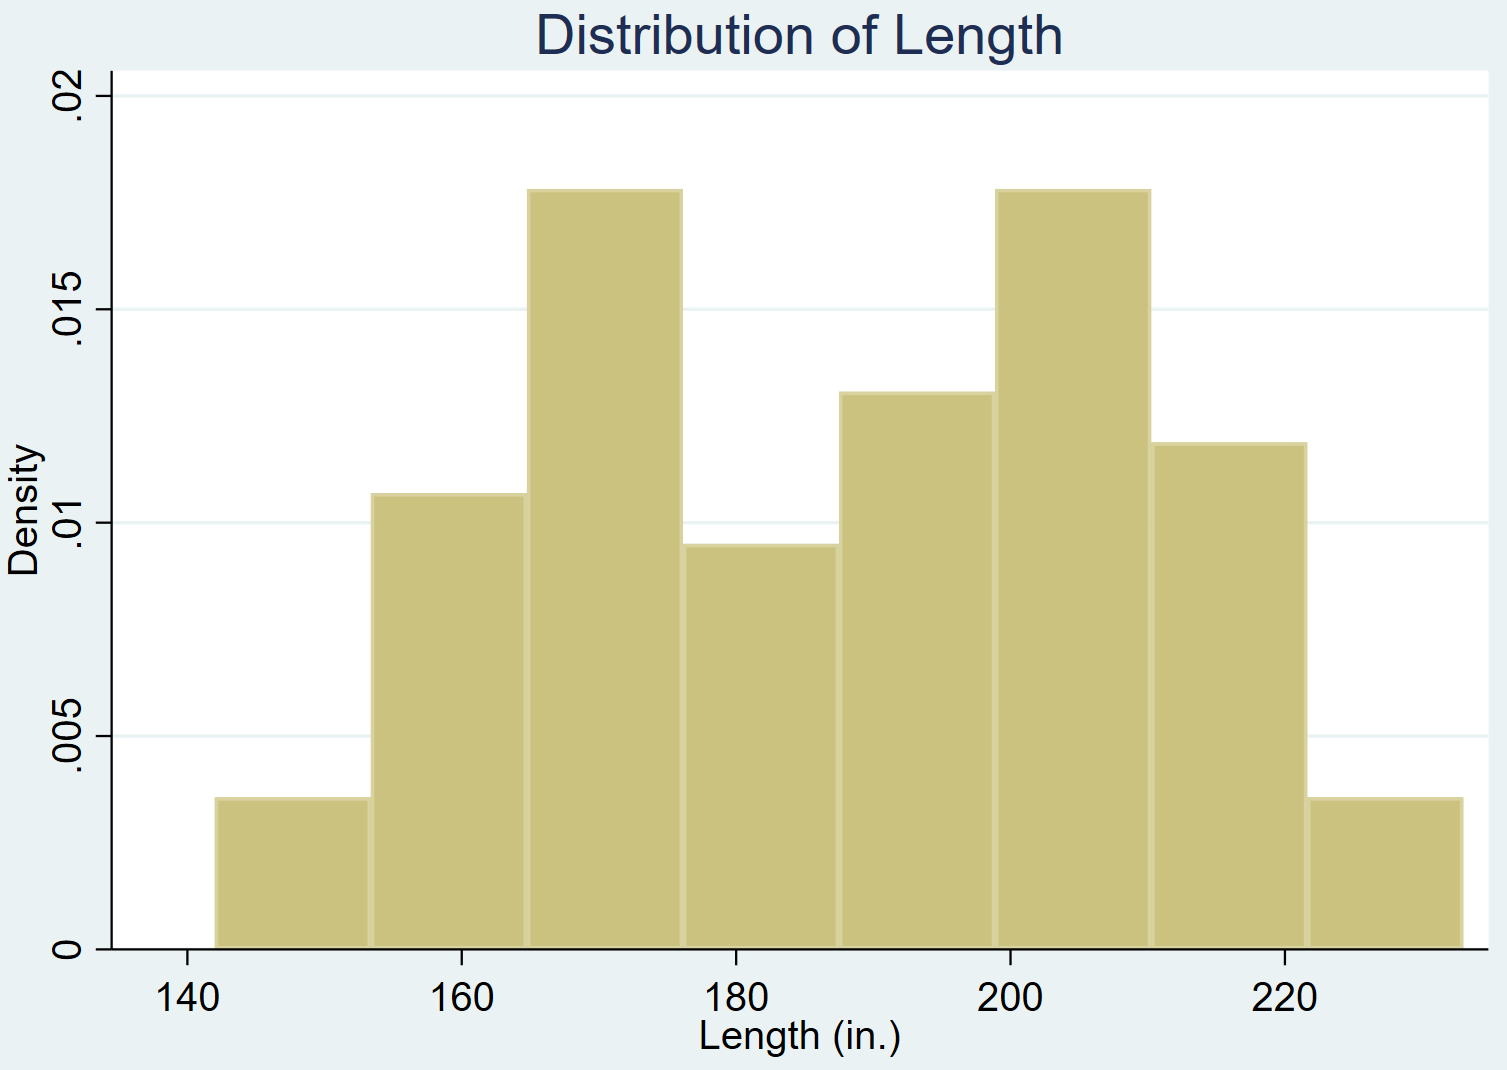
Adding a Title
We can add a title to the plot using the title() command:
hist length, title(“Distribution of Length”)
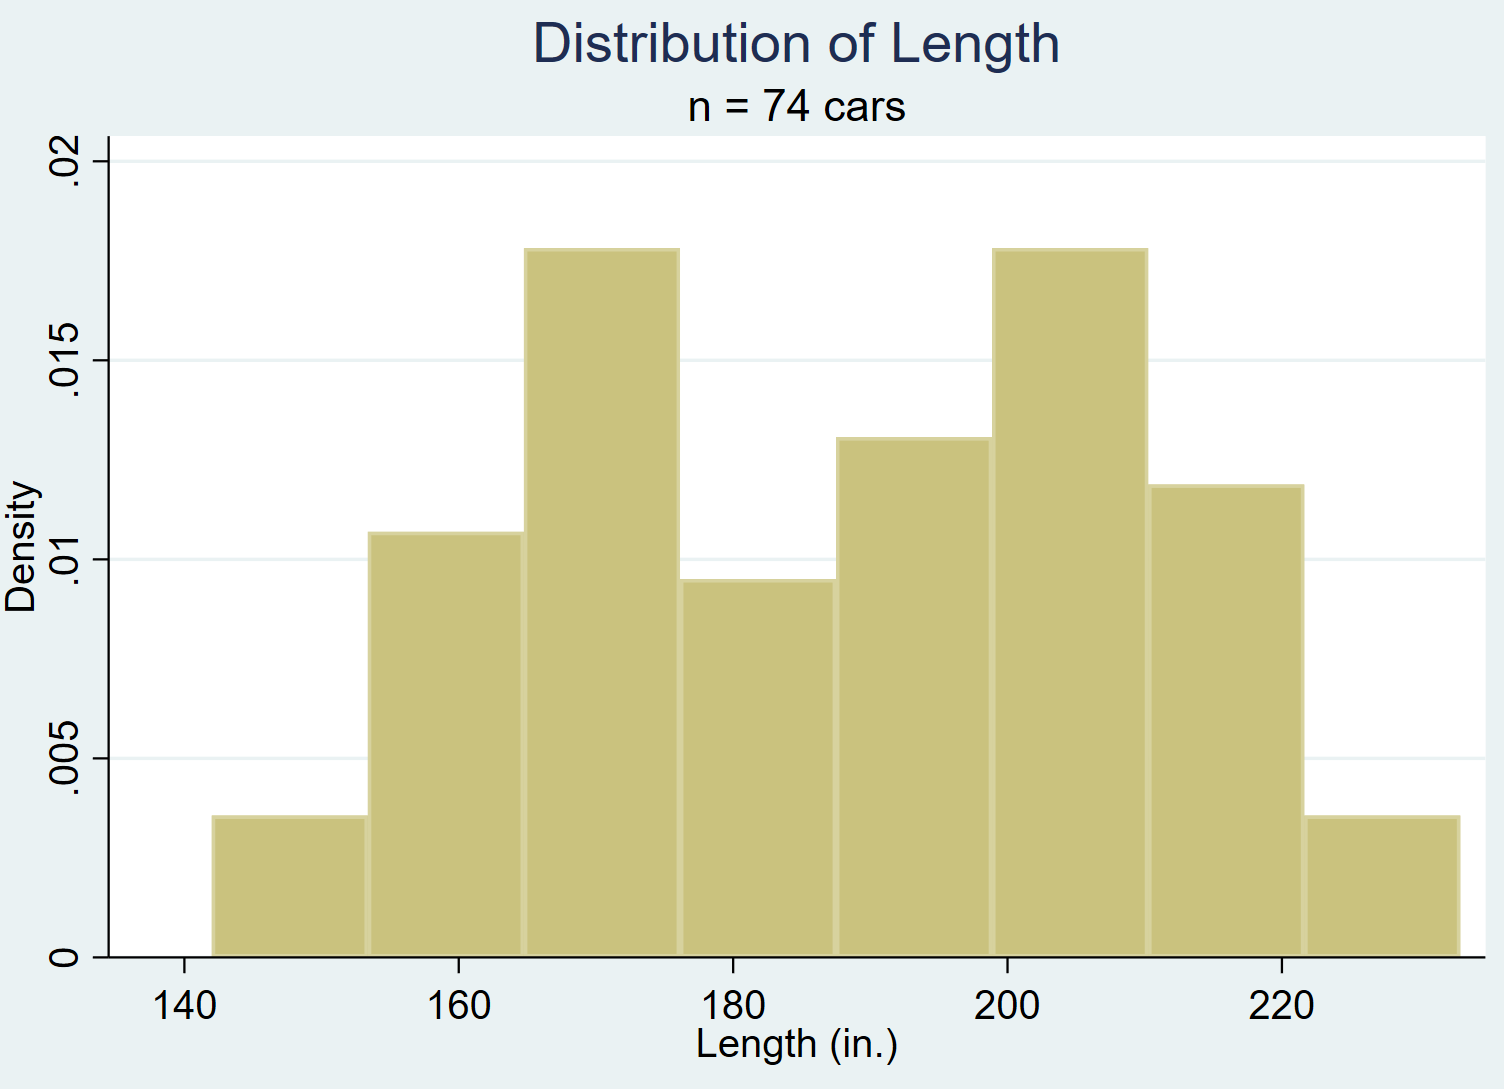
Adding a Subtitle
We can also add a subtitle underneath the title using the subtitle() command:
hist length, title(“Distribution of Length”) subtitle(“n = 74 cars”)
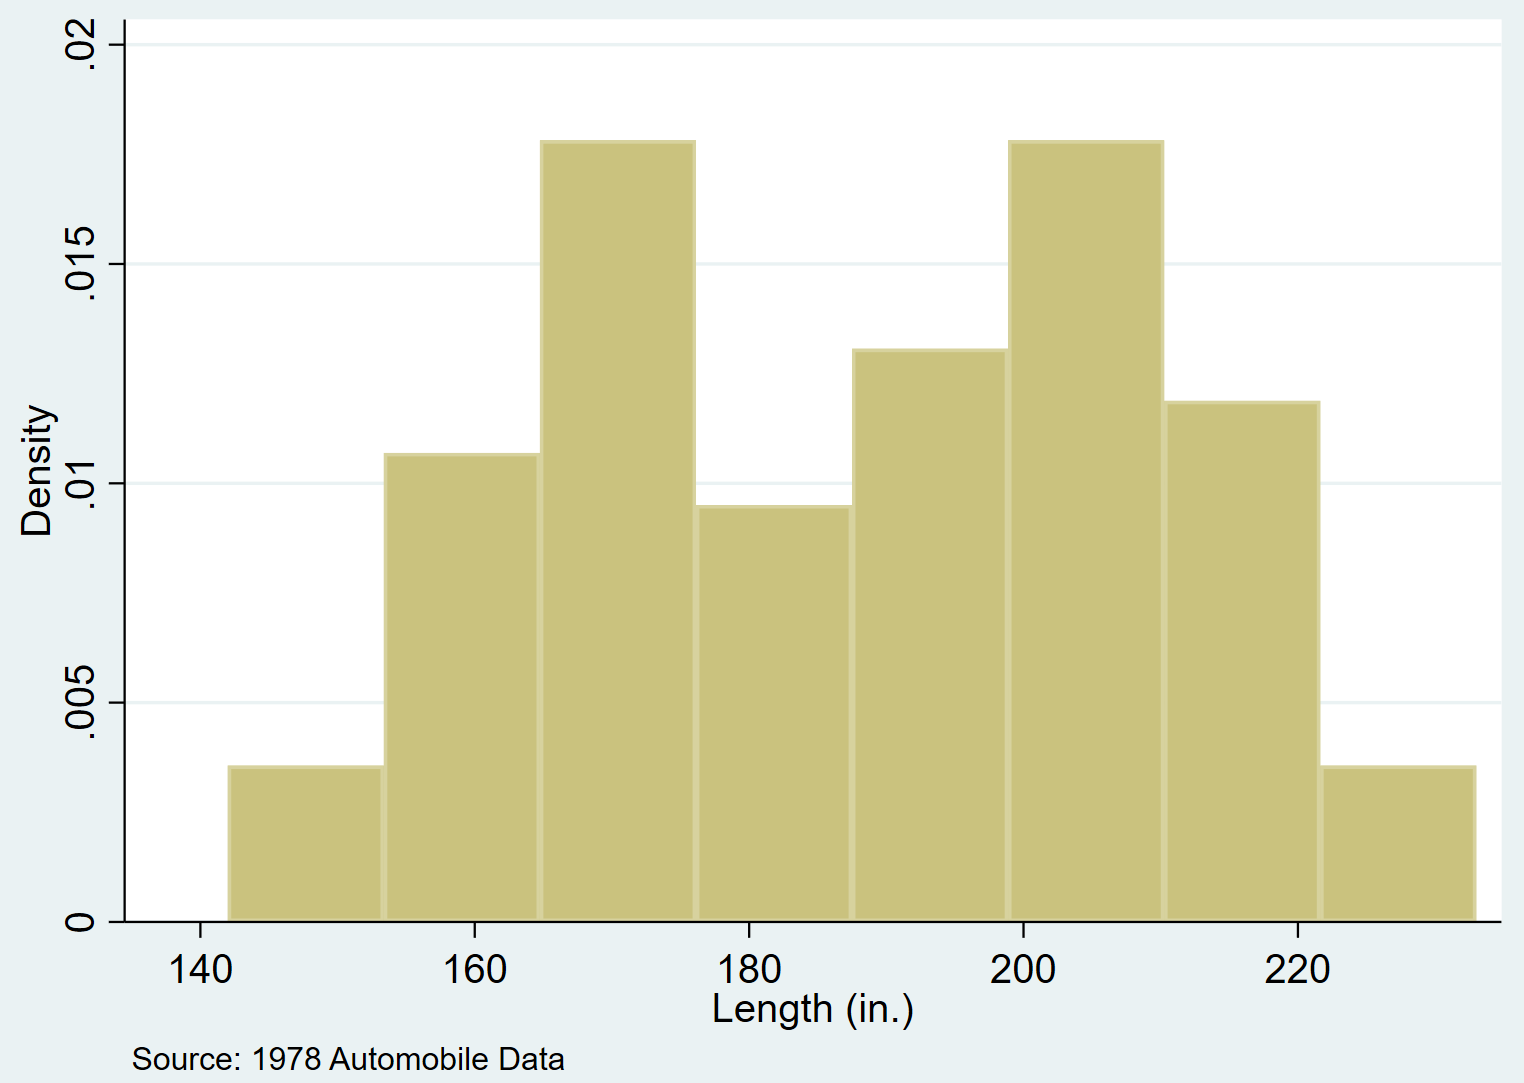
Adding a Comment
We can also add a note or comment at the bottom of the graph by using the note() command:
hist length, note(“Source: 1978 Automobile Data”)