Hierarchical regression is a technique we can use to compare several different linear models.
The basic idea is that we first fit a linear regression model with just one explanatory variable. Then we fit another regression model using an additional explanatory variable. If the R-squared (the proportion of variance in the response variable that can be explained by the explanatory variables) in the second model is significantly higher than the R-squared in the previous model, this means the second model is better.
We then repeat the process of fitting additional regression models with more explanatory variables and seeing if the newer models offer any improvement over the previous models.
This tutorial provides an example of how to perform hierarchical regression in Stata.
Example: Hierarchical Regression in Stata
We’ll use a built-in dataset called auto to illustrate how to perform hierarchical regression in Stata. First, load the dataset by typing the following into the Command box:
sysuse auto
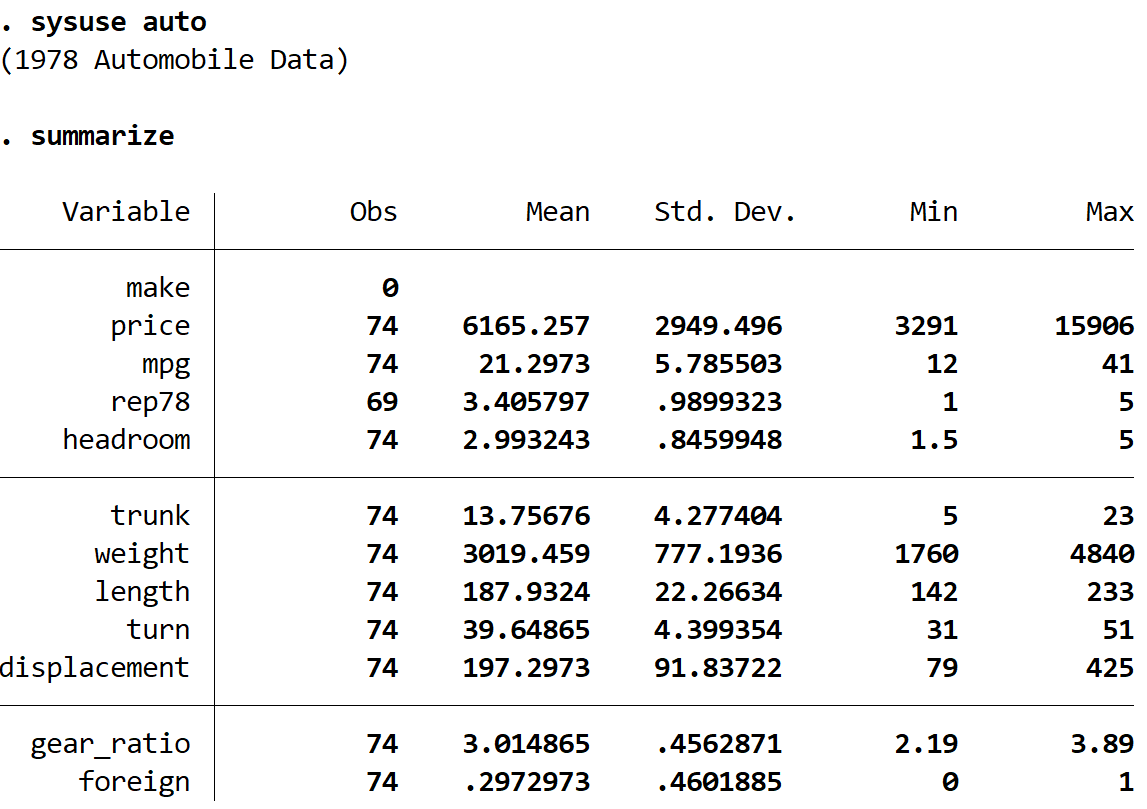
We can get a quick summary of the data by using the following command:
summarize
We can see that the dataset contains information about 12 different variables for 74 total cars.
We will fit the following three linear regression models and use hierarchical regression to see if each subsequent model provides a significant improvement to the previous model or not:
Model 1: price = intercept + mpg
Model 2: price = intercept + mpg + weight
Model 3: price = intercept + mpg + weight + gear ratio
In order to perform hierarchical regression in Stata, we will first need to install the hireg package. To do so, type the following into the Command box:
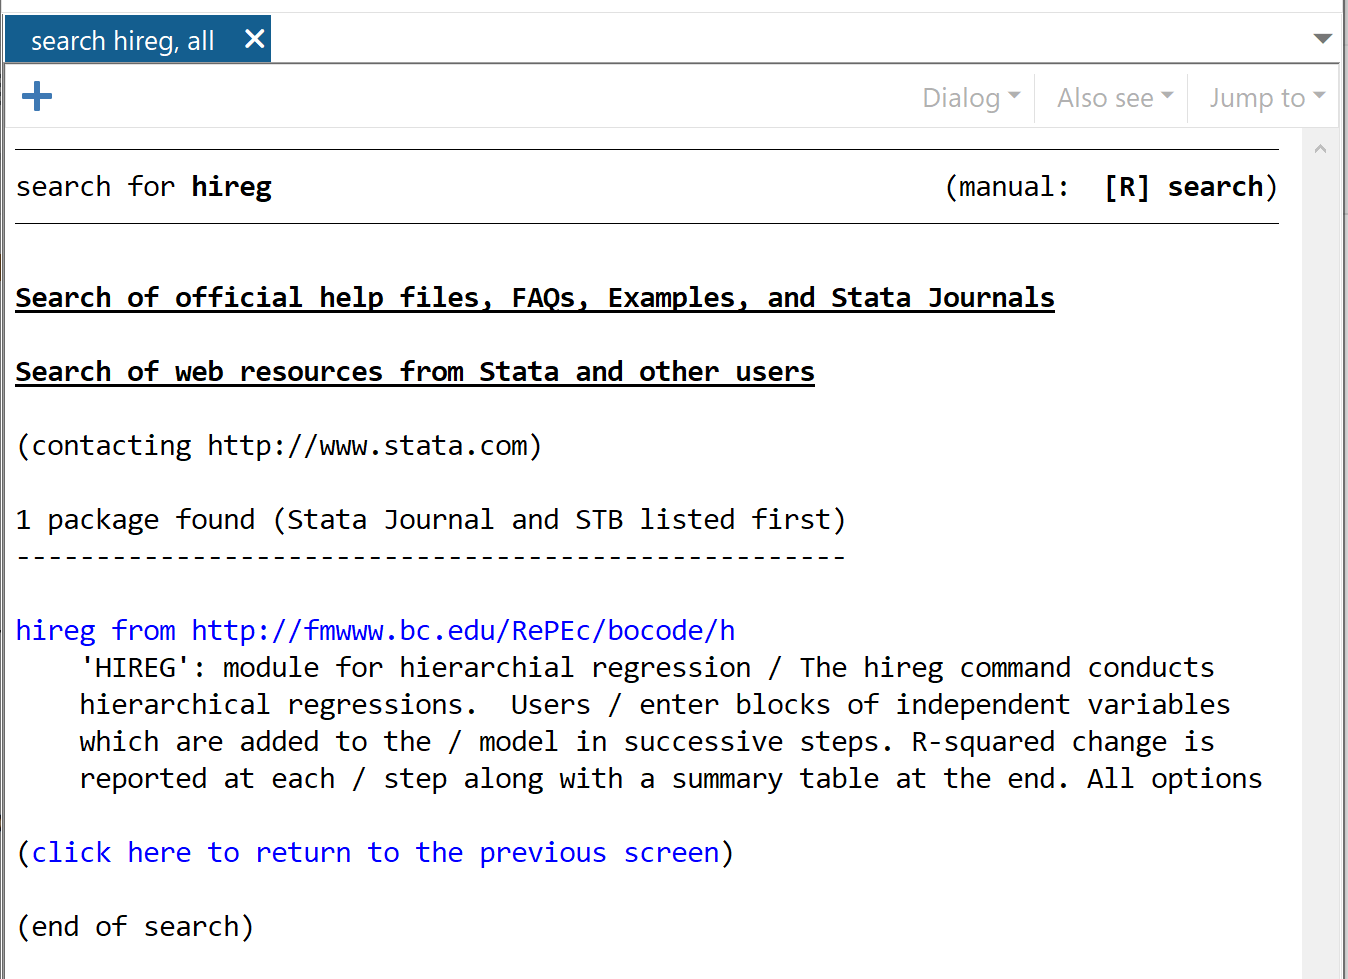
findit hireg
In the window that pops up, click hireg from https://fmwww.bc.edu/RePEc/bocode/h
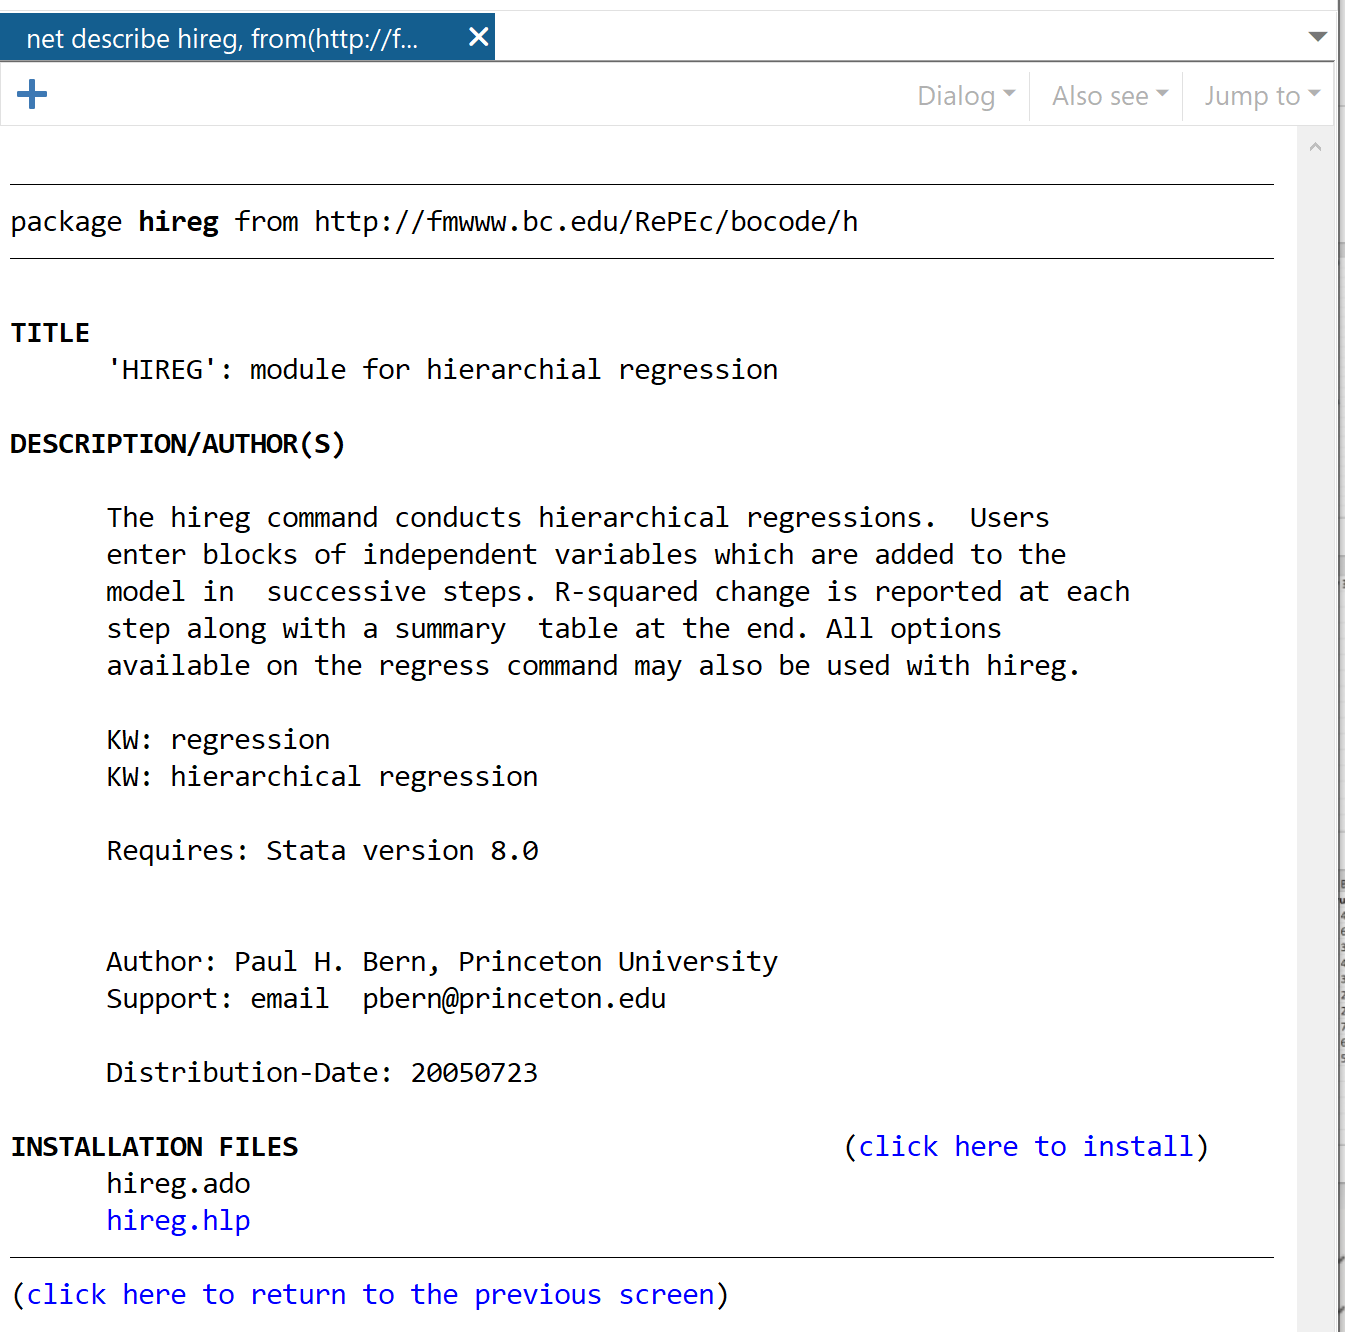
In the next window, click the link that says click here to install.
The package will install in a matter of seconds. Next, to perform hierarchical regression we will use the following command:
hireg price (mpg) (weight) (gear_ratio)
Here is what this tells Stata to do:
- Perform hierarchical regression using price as the response variable in each model.
- For the first model, use mpg as the explanatory variable.
- For the second model, add in weight as an additional explanatory variable.
- For the third model, add in gear_ratio as another explanatory variable.
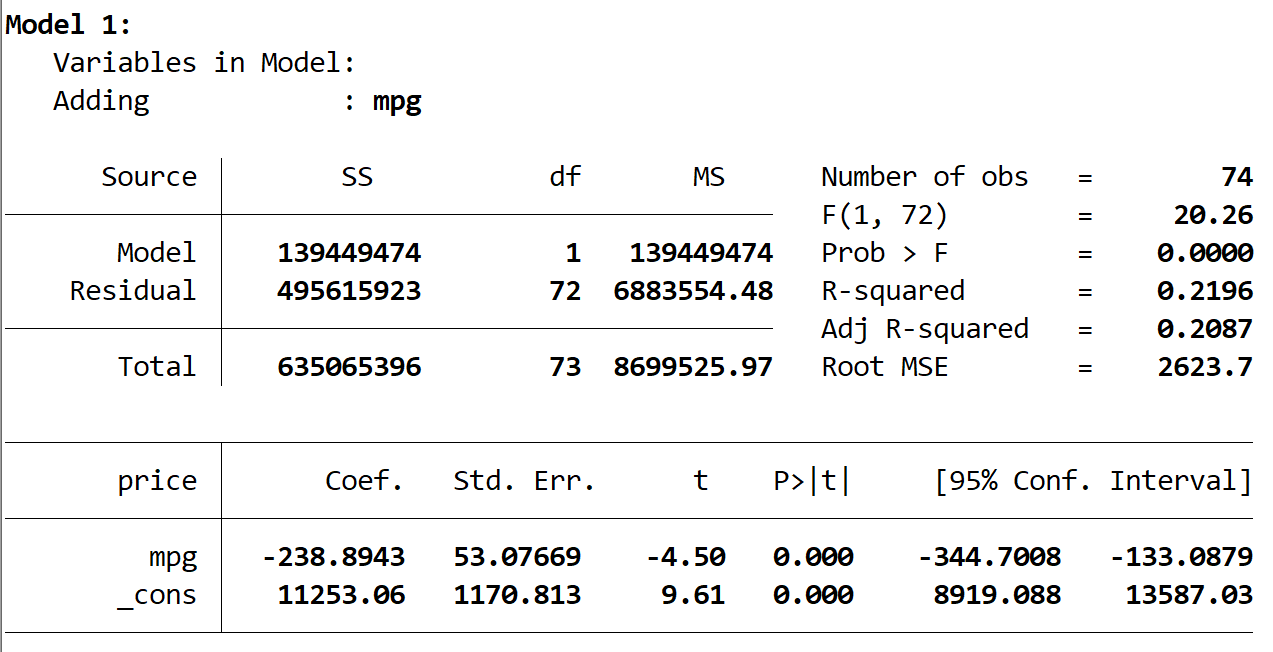
Here is the output of the first model:
We see that the R-squared of the model is 0.2196 and the overall p-value (Prob > F) for the model is 0.0000, which is statistically significant at α = 0.05.
Next, we see the output of the second model:
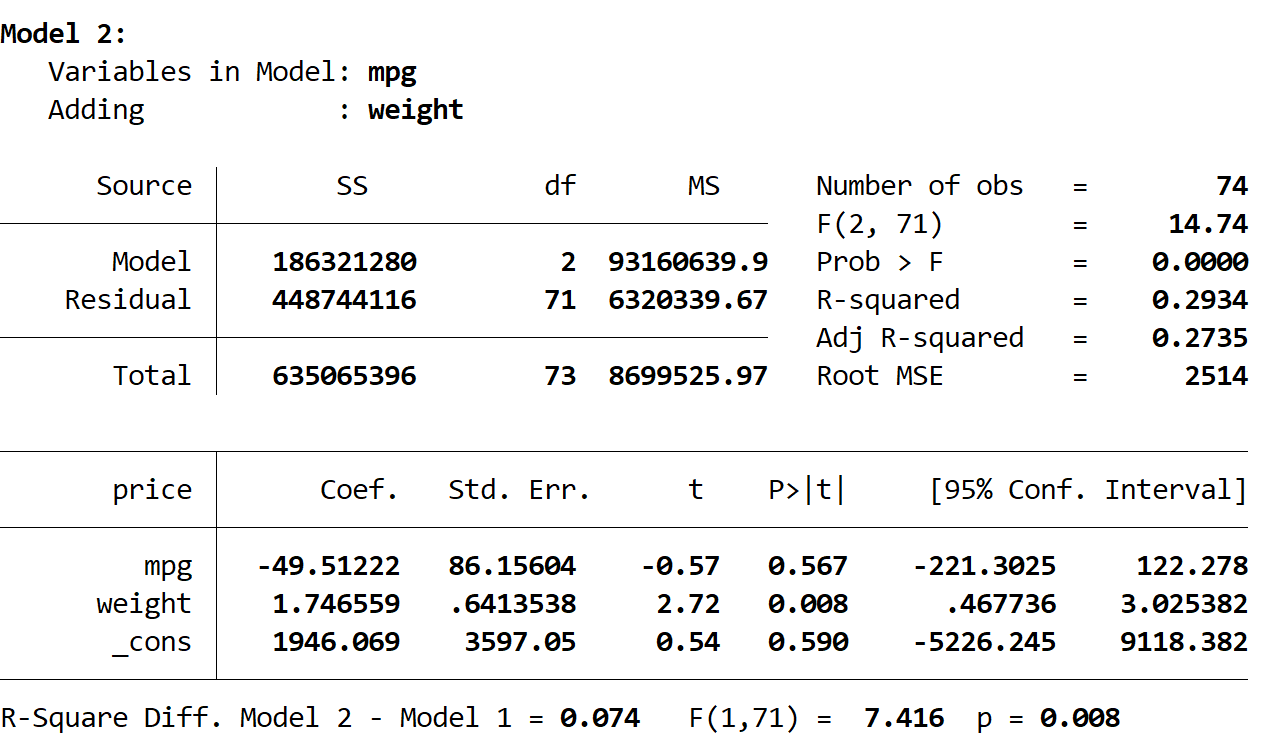
The R-squared of this model is 0.2934, which is larger than the first model. To determine if this difference is statistically significant, Stata performed an F-test which resulted in the following numbers at the bottom of the output:
- R-squared difference between the two models = 0.074
- F-statistic for the difference = 7.416
- Corresponding p-value of the F-statistic = 0.008
Because the p-value is less than 0.05, we conclude that there is a statistically significant improvement in the second model compared to the first model.
Lastly, we can see the output of the third model:
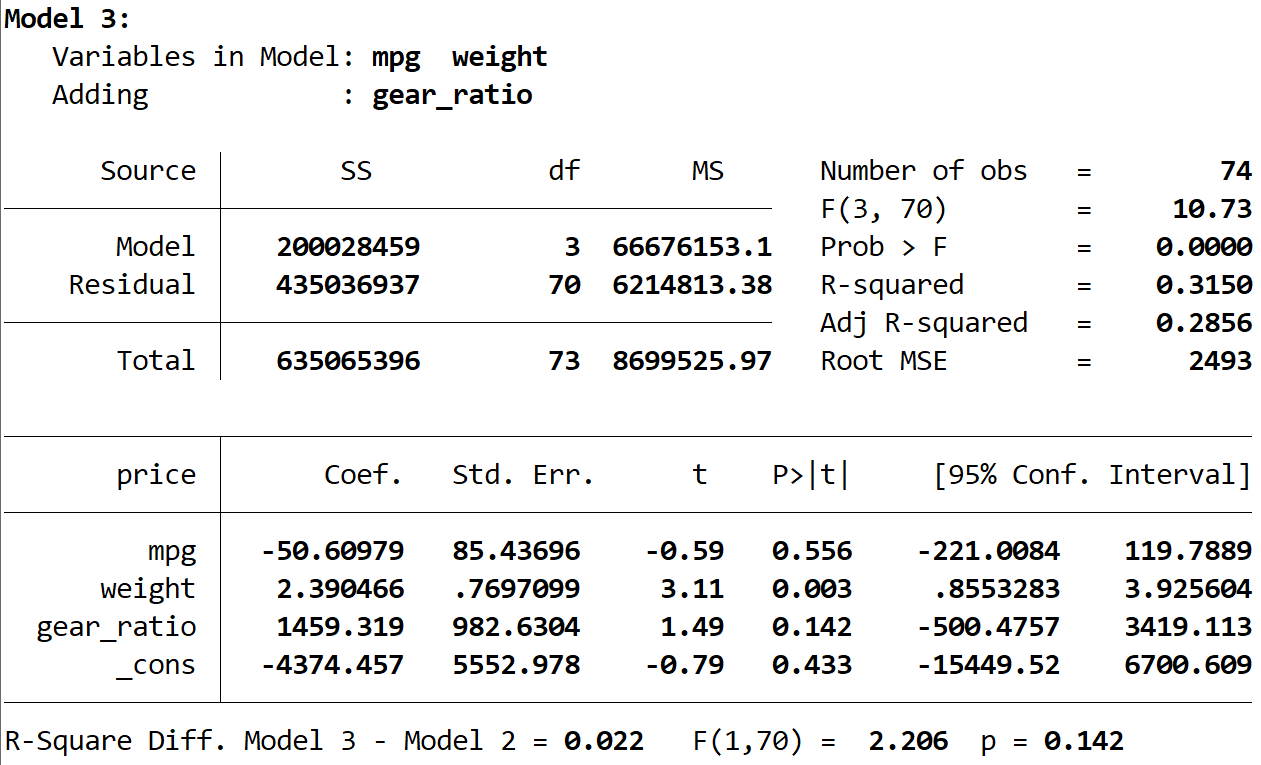
The R-squared of this model is 0.3150, which is larger than the second model. To determine if this difference is statistically significant, Stata performed an F-test which resulted in the following numbers at the bottom of the output:
- R-squared difference between the two models = 0.022
- F-statistic for the difference = 2.206
- Corresponding p-value of the F-statistic = 0.142
Because the p-value is not less than 0.05, we don’t have sufficient evidence to say that the third model offers any improvement over the second model.
At the very end of the output we can see that Stata provides a summary of the results:
In this particular example, we would conclude that model 2 offered a significant improvement over model 1, but model 3 did not offer a significant improvement over model 2.


