You can use the following syntax to change the size of elements in a ggplot2 legend:
ggplot(data, aes(x=x, y=y)) +
  theme(legend.key.size = unit(1, 'cm'), #change legend key size
        legend.key.height = unit(1, 'cm'), #change legend key height
        legend.key.width = unit(1, 'cm'), #change legend key width
        legend.title = element_text(size=14), #change legend title font size
        legend.text = element_text(size=10)) #change legend text font size
The following examples show how to use these arguments in practice.
Change ggplot2 Legend Key Size
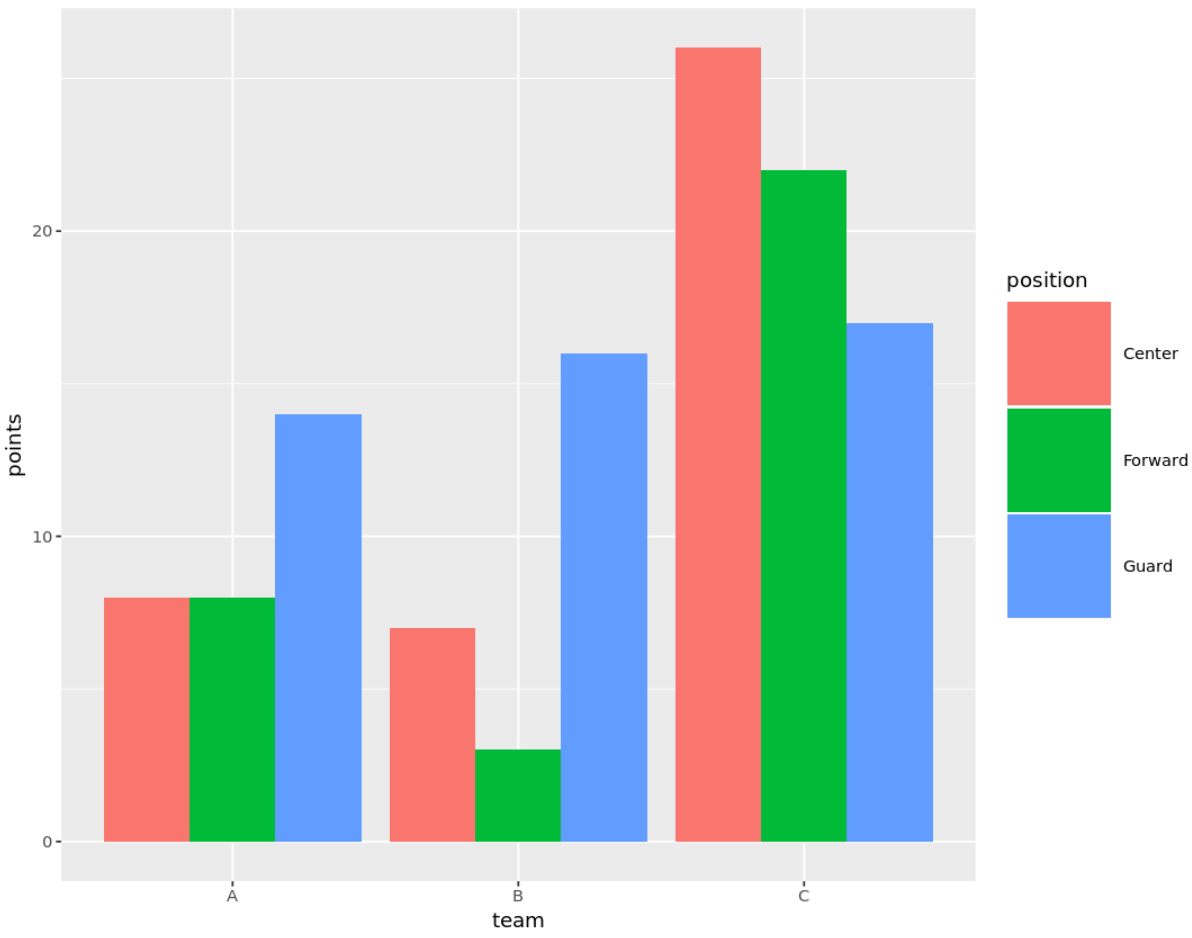
Suppose we create the following grouped barplot using ggplot2:
library(ggplot2)

#create data frame
df A', 'B', 'C'), each=3),
                 position=rep(c('Guard', 'Forward', 'Center'), times=3),
                 points=c(14, 8, 8, 16, 3, 7, 17, 22, 26))

#create grouped barplot
ggplot(df, aes(fill=position, y=points, x=team)) +
  geom_bar(position='dodge', stat='identity')

By default, ggplot2 provides a legend to the right of the graph.
The following code shows how to use the legend.key.size argument to make the keys of the legend larger:
ggplot(df, aes(fill=position, y=points, x=team)) +
  geom_bar(position='dodge', stat='identity') +
  theme(legend.key.size = unit(2, 'cm'))
We can also use the legend.key.width and legend.key.height arguments to specify widths and heights for the keys:
ggplot(df, aes(fill=position, y=points, x=team)) +
  geom_bar(position='dodge', stat='identity') +
  theme(legend.key.height= unit(2, 'cm'),
        legend.key.width= unit(4, 'cm'))

Change ggplot2 Legend Title Font Size
We can use the legend.title argument to make the legend title font size larger:
ggplot(df, aes(fill=position, y=points, x=team)) +
  geom_bar(position='dodge', stat='identity') +
  theme(legend.title = element_text(size=30))

Change ggplot2 Legend Text Font Size
We can use the legend.text argument to make the legend title font size larger:
ggplot(df, aes(fill=position, y=points, x=team)) +
  geom_bar(position='dodge', stat='identity') +
  theme(legend.text = element_text(size=30))

Additional Resources
How to Change the Legend Title in ggplot2
How to Change Legend Position in ggplot2
How to Remove a Legend in ggplot2