You can plot a smooth line in ggplot2 by using the geom_smooth() function, which uses the following basic syntax:
ggplot(df, aes(x=x, y=y)) +
  geom_smooth()
This tutorial shows several examples of how to use this function in practice.
Example: Create Smooth Lines in ggplot2
Suppose we have the following data frame:
df
We can use the following code to create a scatterplot of the values in the data frame and add a smooth line to capture the trend:
library(ggplot2)

ggplot(df, aes(x=x, y=y)) +
  geom_point() +
  geom_smooth()

By default, the geom_smooth() function uses a loess method to fit the line to the dataset, but we can specify a different method such as lm to fit a straight line to the dataset instead:
ggplot(df, aes(x=x, y=y)) +
  geom_point() +
  geom_smooth(method='lm')
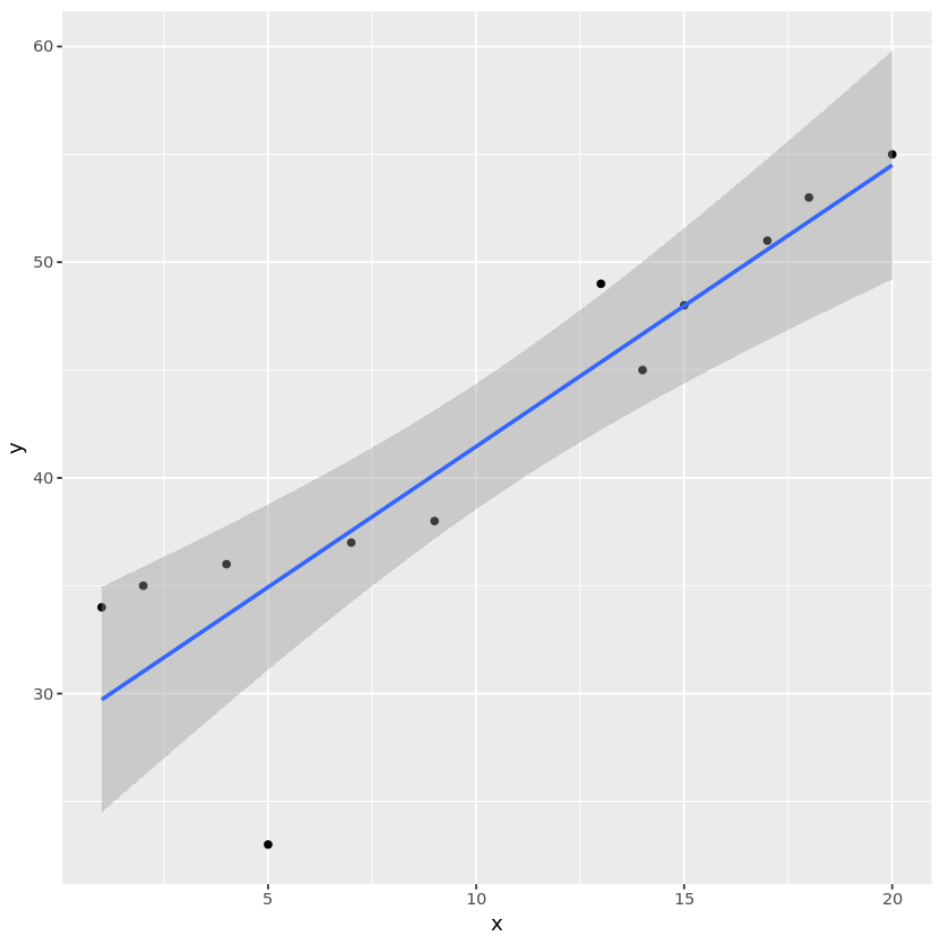
We can also hide the standard error bands by specifying se=FALSE:
ggplot(df, aes(x=x, y=y)) +
  geom_point() +
  geom_smooth(method='lm', se=FALSE)

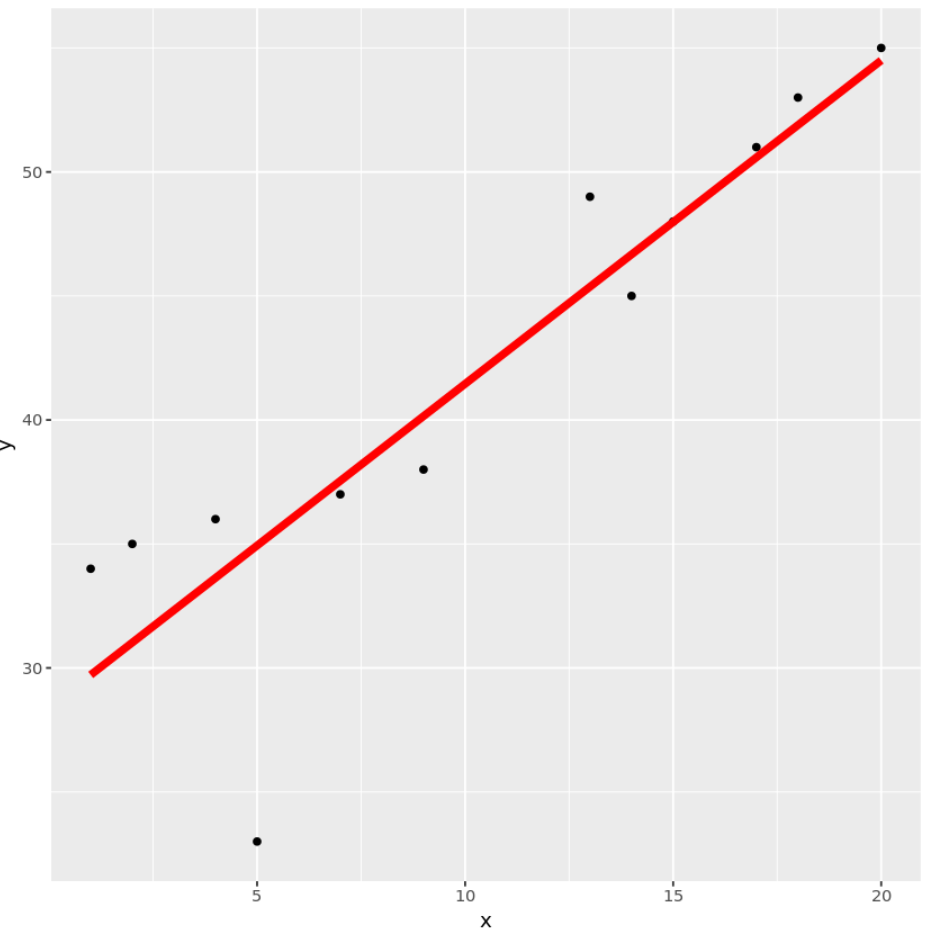
You can also quickly change the size and color of the line by using the size and col arguments:
ggplot(df, aes(x=x, y=y)) +
  geom_point() +
  geom_smooth(method='lm', se=FALSE, col='red', size=2)
You can find the complete documentation for the geom_smooth() function here.
Additional Resources
How to Plot a Linear Regression Line in ggplot2
How to Add a Vertical Line to a Plot Using ggplot2
How to Create Side-by-Side Plots in ggplot2