The easiest way to remove gridlines in ggplot2 is to use theme_classic():
ggplot(df, aes(x=x, y=y)) +
  geom_point() +
  theme_classic()
Alternatively, you can use the following syntax to remove specific gridlines:
ggplot(df, aes(x=x, y=y)) +
  geom_point() +
  theme_bw() +
  theme(axis.line = element_line(color='black'),
    plot.background = element_blank(),
    panel.grid.major = element_blank(),
    panel.grid.minor = element_blank(),
    panel.border = element_blank())
The following examples show how to use both of these methods in practice.
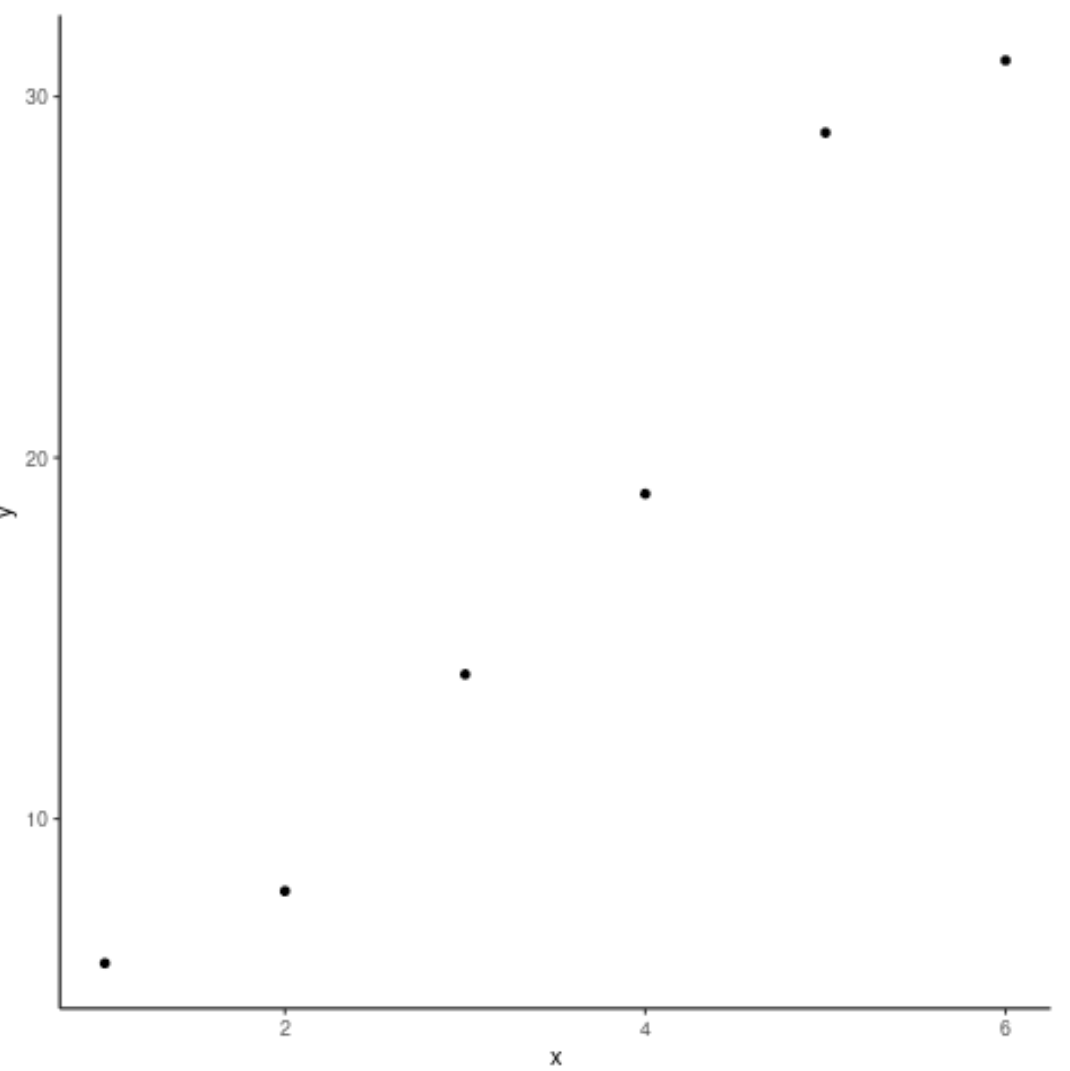
Example 1: Remove Gridlines with theme_classic()
The following code shows how to remove gridlines from a ggplot2 plot using theme_classic():
library(ggplot2)

#define data
df frame(x=c(1, 2, 3, 4, 5, 6),
                 y=c(6, 8, 14, 19, 29, 31))

#create ggplot with no gridlines
ggplot(df, aes(x=x, y=y)) +
  geom_point() +
  theme_classic()
Example 2: Remove Specific Gridlines
The following code shows how to remove gridlines from a ggplot2 plot using a bit more customization:
library(ggplot2)

#define data
df frame(x=c(1, 2, 3, 4, 5, 6),
                 y=c(6, 8, 14, 19, 29, 31))

#create ggplot with no gridlines
ggplot(df, aes(x=x, y=y)) +
  geom_point() +
  theme_bw() +
  theme(axis.line = element_line(color='black'),
    plot.background = element_blank(),
    panel.grid.major = element_blank(),
    panel.grid.minor = element_blank(),
    panel.border = element_blank())
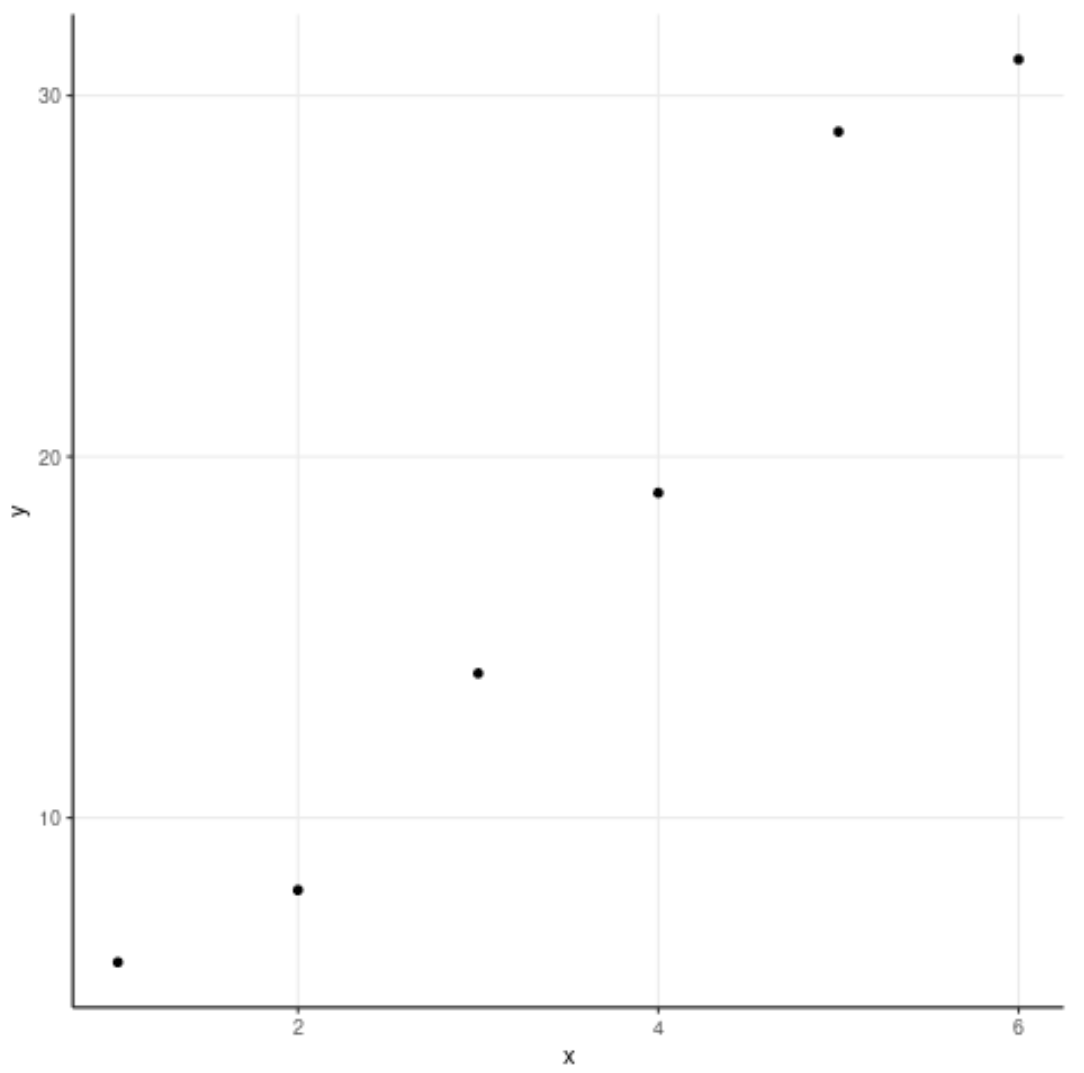
This code allows you to remove specific gridlines. For example, we could use the following code to keep the major gridlines in the plot:
library(ggplot2)

#define data
df frame(x=c(1, 2, 3, 4, 5, 6),
                 y=c(6, 8, 14, 19, 29, 31))

#create ggplot with no gridlines
ggplot(df, aes(x=x, y=y)) +
  geom_point() +
  theme_bw() +
  theme(axis.line = element_line(color='black'),
    plot.background = element_blank(),
    panel.grid.minor = element_blank(),
    panel.border = element_blank())
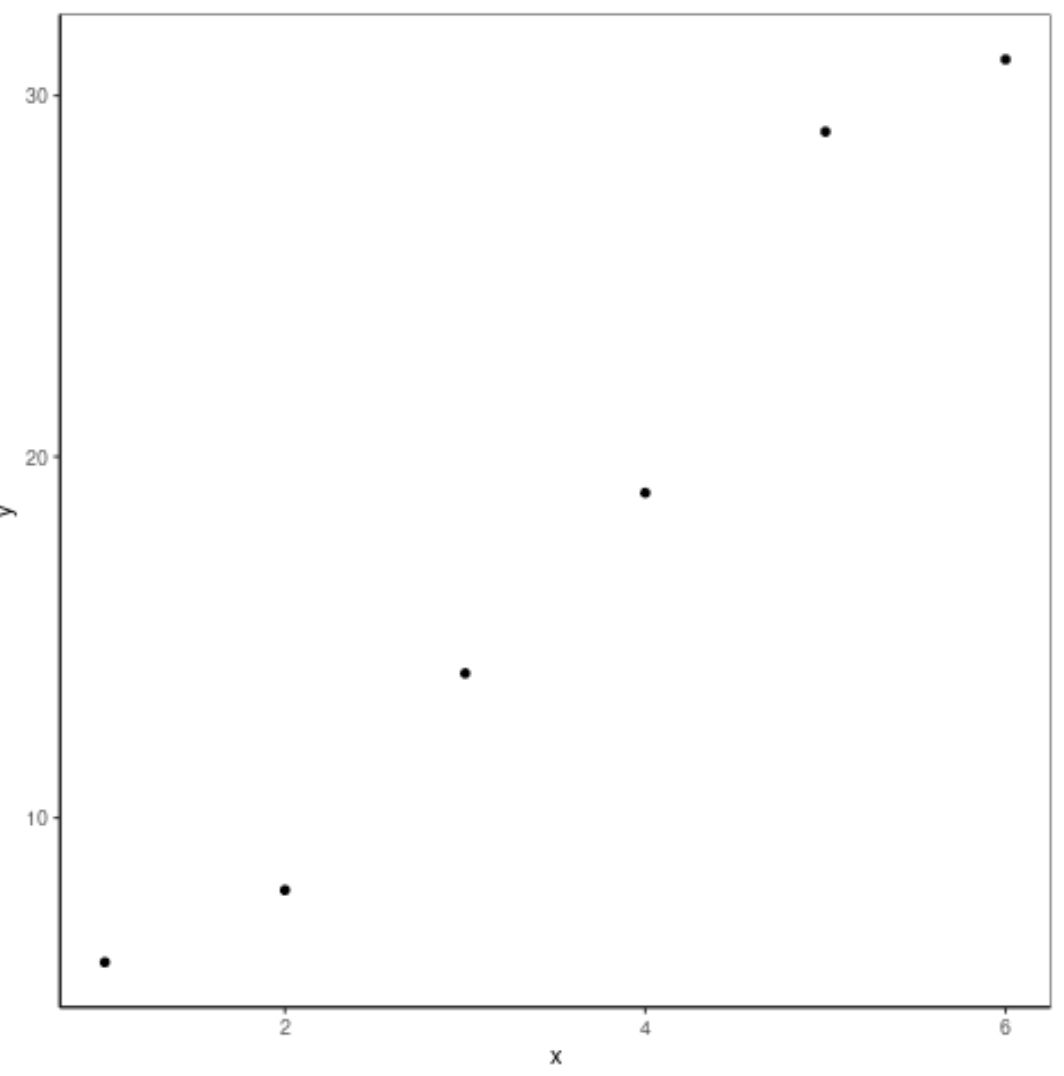
Alternatively, we could use the following code to remove all gridlines but keep the panel border in the plot:
library(ggplot2)

#define data
df frame(x=c(1, 2, 3, 4, 5, 6),
                 y=c(6, 8, 14, 19, 29, 31))

#create ggplot with no gridlines
ggplot(df, aes(x=x, y=y)) +
  geom_point() +
  theme_bw() +
  theme(axis.line = element_line(color='black'),
    plot.background = element_blank(),
    panel.grid.minor = element_blank(),
    panel.grid.major = element_blank())
Additional Resources
A Complete Guide to the Best ggplot2 Themes
How to Change the Legend Title in ggplot2
How to Set Axis Limits in ggplot2
How to Adjust Line Thickness in ggplot2