You can use the size argument to adjust the thickness of a line in ggplot2:
ggplot(df, aes(x = x, y = y)) +
  geom_line(size = 1.5)
The size is equal to 1 by default, but you can specify any decimal value you’d like to adjust the thickness.
This tutorial provides an example of how to adjust line thickness in practice.
Example: Adjust Line Thickness in ggplot2
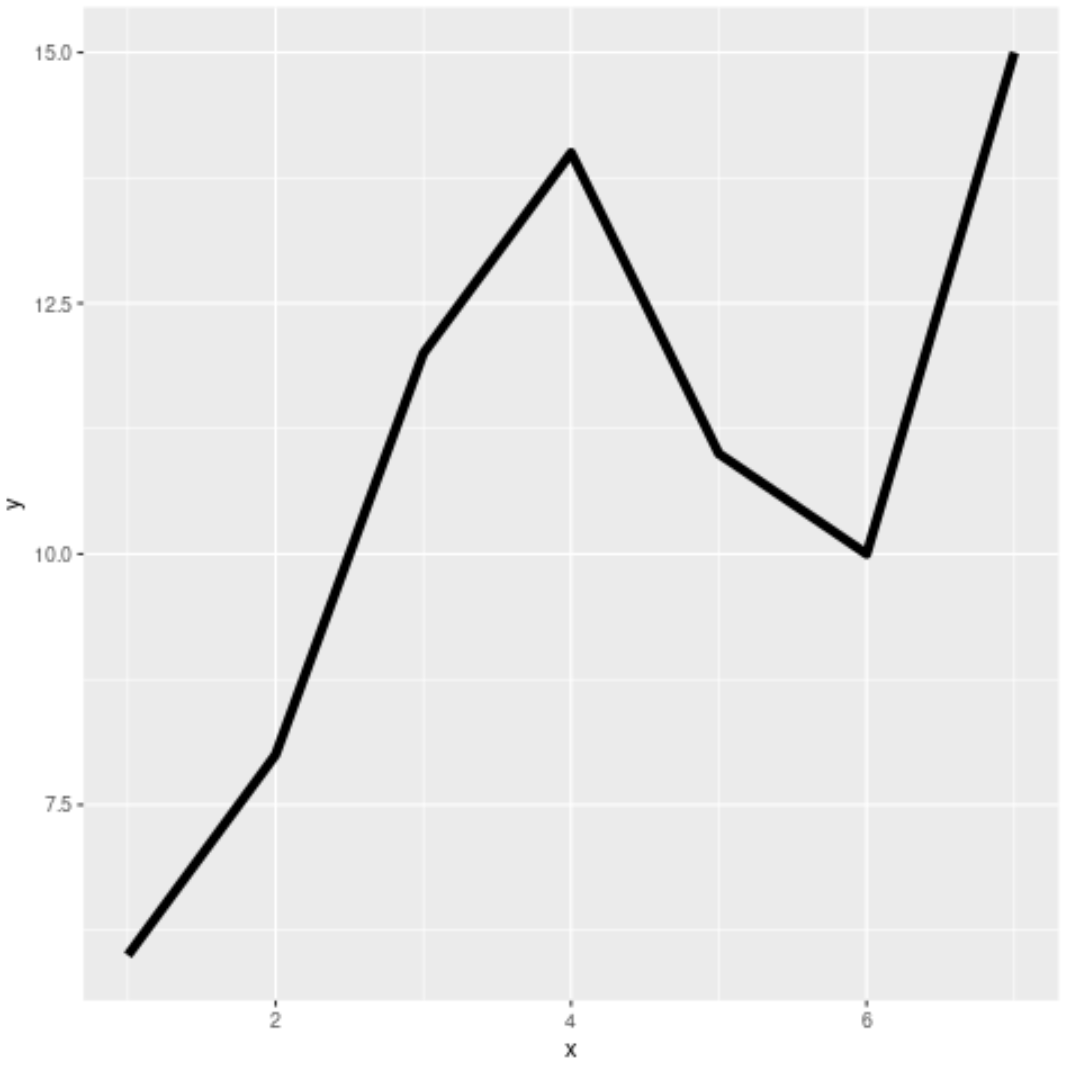
The following code shows how to create a simple line plot using ggplot2:
#load ggplot2 visualization package
library(ggplot2)

#create data
df frame(x=c(1, 2, 3, 4, 5, 6, 7),
                 y=c(6, 8, 12, 14, 11, 10, 15))

#create line plot
ggplot(df, aes(x = x, y = y)) +
  geom_line()

By default, the line thickness is equal to 1 but we can increase it by using the size argument:
library(ggplot2)

#create line plot
ggplot(df, aes(x = x, y = y)) +
  geom_line(size = 2)
The following code displays various line plots using different sizes for the line thickness:
library(ggplot2)
library(gridExtra)

#create data
df frame(x=c(1, 2, 3, 4, 5, 6, 7),
                 y=c(6, 8, 12, 14, 11, 10, 15))

#create four line plots
plot1 aes(x=x,y=y)) + geom_line() + ggtitle("Size = 1 (Default)")
plot2 aes(x=x,y=y)) + geom_line(size=1.5) + ggtitle("Size = 1.5")
plot3 aes(x=x,y=y)) + geom_line(size=2) + ggtitle("Size = 2")
plot4 aes(x=x,y=y)) + geom_line(size=3) + ggtitle("Size = 3")

#display all line plots stacked on top of each other
grid.arrange(plot1, plot2, plot3, plot4, ncol=1)

The larger the value given to the size argument, the thicker the line will be in the plot.
Find more R tutorials here.